RRB NTPC · પ્રશ્ન 54
નીચે આપેલ ડેટાનો મોડ શું છે? [તમારો જવાબ 2 દશાંશ સ્થાનો સુધી સાચો આપો.]
| વર્ષોમાં ઉંમર | 20-30 | 30-40 | 40-50 | 50-60 | 60-70 | 70-80 | 80-90 |
|---|---|---|---|---|---|---|---|
| દર્દીઓની સંખ્યા | 36 | 29 | 35 | 22 | 18 | 38 | 26 |
જવાબ બતાવો અને સમજૂતીસમજૂતી જુઓ
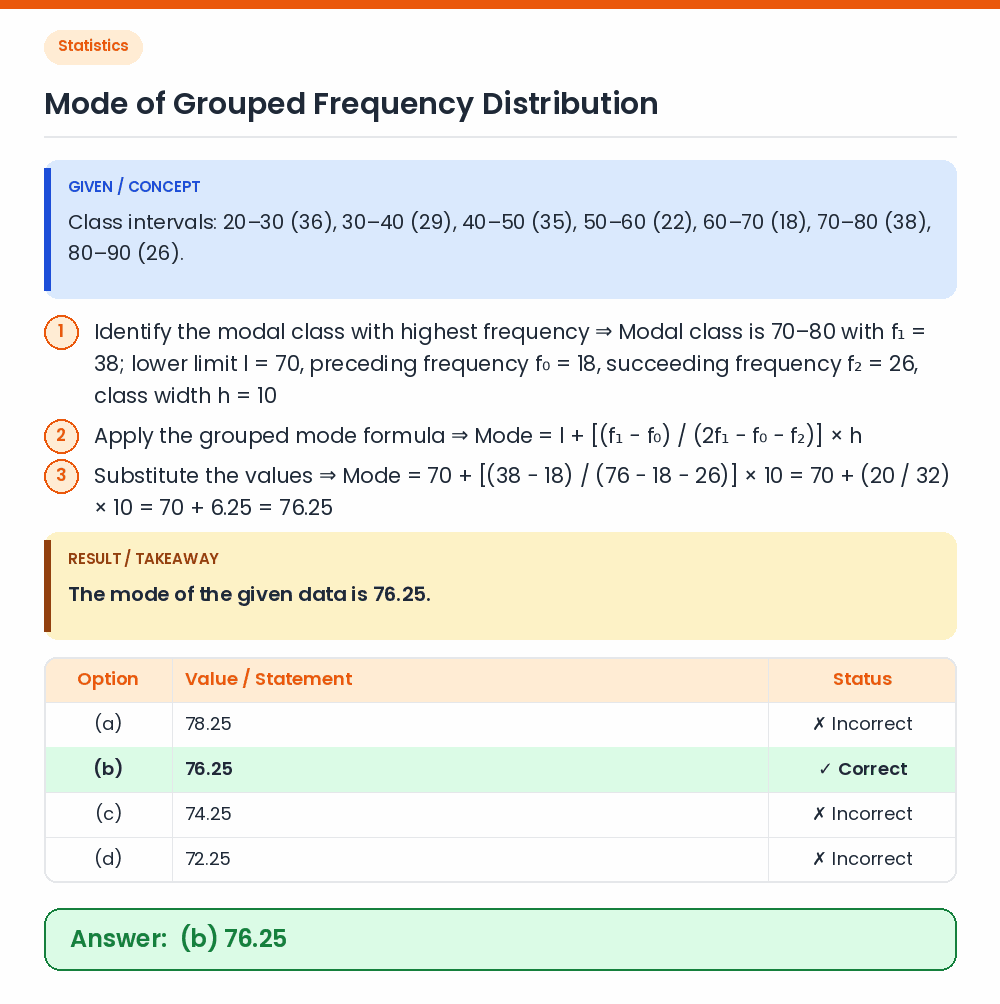
જવાબ: (B) 76.25
GIVEN / CONCEPT: Class intervals: 20–30 (36), 30–40 (29), 40–50 (35), 50–60 (22), 60–70 (18), 70–80 (38), 80–90 (26). Step 1 (Relation / Equation): Identify the modal class with highest frequency ⇒ Modal class is 70–80 with f₁ = 38; lower limit l = 70, preceding frequency f₀ = 18, succeeding frequency f₂ = 26, class width h = 10 Step 2 (Simplification / Calculation): Apply the grouped mode formula ⇒ Mode = l + [(f₁ − f₀) / (2f₁ − f₀ − f₂)] × h Step 3 (Verification / Deduction): Substitute the values ⇒ Mode = 70 + [(38 − 18) / (76 − 18 − 26)] × 10 = 70 + (20 / 32) × 10 = 70 + 6.25 = 76.25 RESULT / TAKEAWAY: The mode of the given data is 76.25. Correct Answer: (b) 76.25