Civil Services Examination · प्रश्न 132
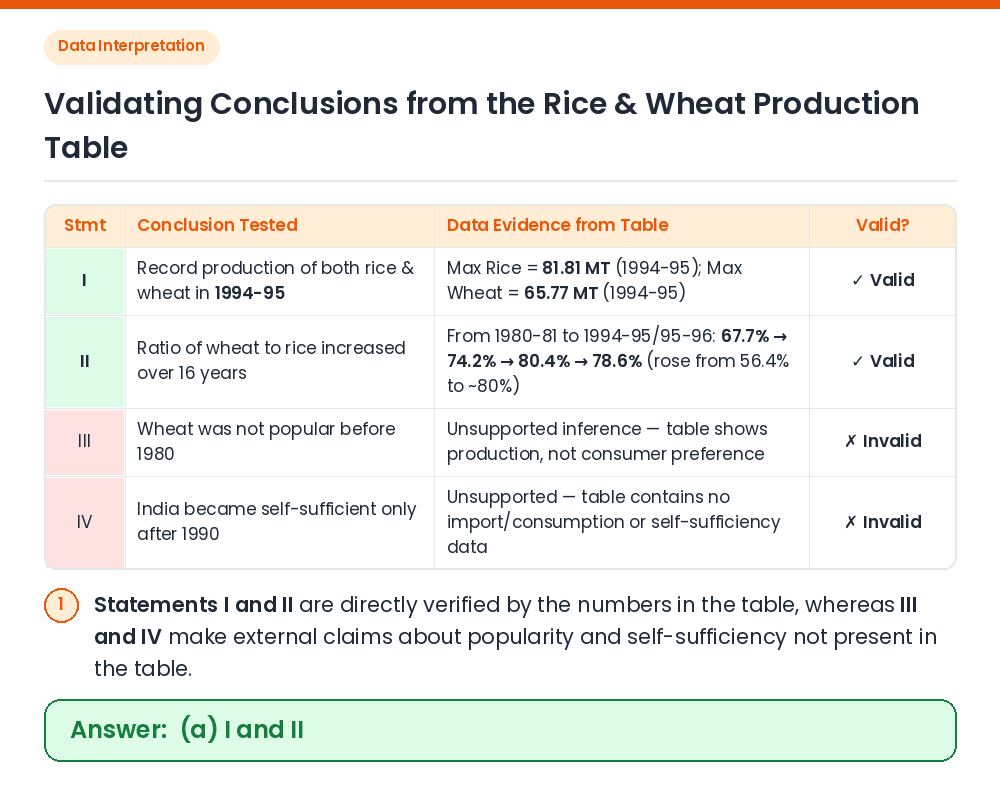
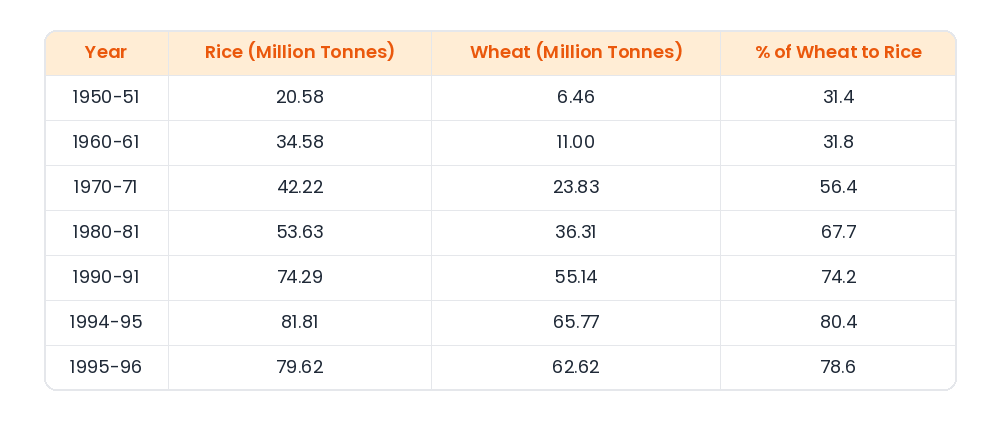
Production of Rice and Wheat (In millions of Tonnes): Year — Rice — Wheat — % of Wheat to Rice 1950-51 — 20.58 — 6.46 — 31.4 1960-61 — 34.58 — 11.00 — 31.8 1970-71 — 42.22 — 23.83 — 56.4 1980-81 — 53.63 — 36.31 — 67.7 1990-91 — 74.29 — 55.14 — 74.2 1994-95 — 81.81 — 65.77 — 80.4 1995-96 — 79.62 — 62.62 — 78.6 The above table indicates the performance of India in rice and wheat production from 1950-51 to 1995-96. Which of the following conclusions arrived at from the above table would be valid? I. Record production of rice as well as wheat has been in 1994-95. II. The ratio of wheat to rice production seems to have steadily increased over 16 years. III. Wheat has not been popular among the Indian population before 1980. IV. India became self-sufficient in rice and wheat only after 1990. Select the correct answer using the codes given below: Codes:
उत्तर देखें और व्याख्याव्याख्या देखें
उत्तर: (A) I and II
Given / Concept: In a table-reading question, only conclusions directly supported by the given numerical columns are valid. Check Statement I: Scanning the Rice column, the highest figure is 81.81 million tonnes in 1994-95; scanning the Wheat column, the highest figure is 65.77 million tonnes, also in 1994-95 ⇒ I is valid. Check Statements II, III & IV: The '% of Wheat to Rice' column rose from 56.4% (1970-71) and 67.7% (1980-81) to 74.2% (1990-91) and 80.4% (1994-95) ⇒ II is valid. Statements III (dietary popularity) and IV (self-sufficiency) cannot be deduced from production tonnage alone ⇒ III and IV are invalid. Result: Only conclusions I and II are valid. Shortcut: Since I is visibly true from row 1994-95 and III/IV introduce outside assumptions, (a) I and II is immediate. Correct Answer: (a) I and II