Civil Services Examination · प्रश्न 43
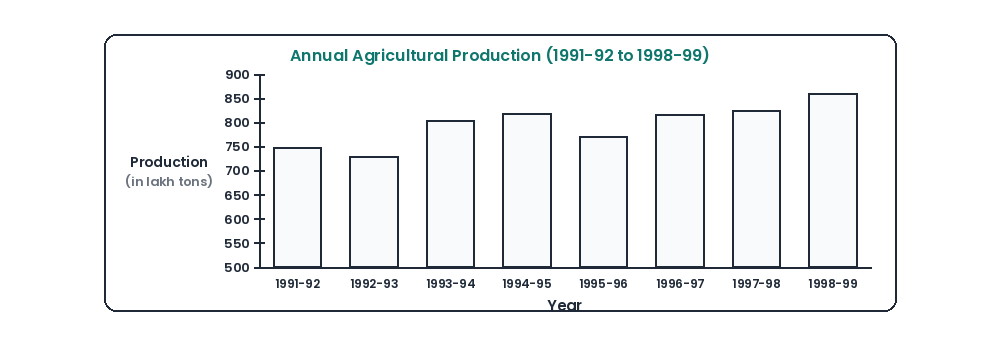
The annual agricultural production of a product for the period 1991-92 to 1998-99 is shown in the figure given above. Which one of the following is the product in question?
उत्तर देखें और व्याख्याव्याख्या देखें
उत्तर: (D) Rice
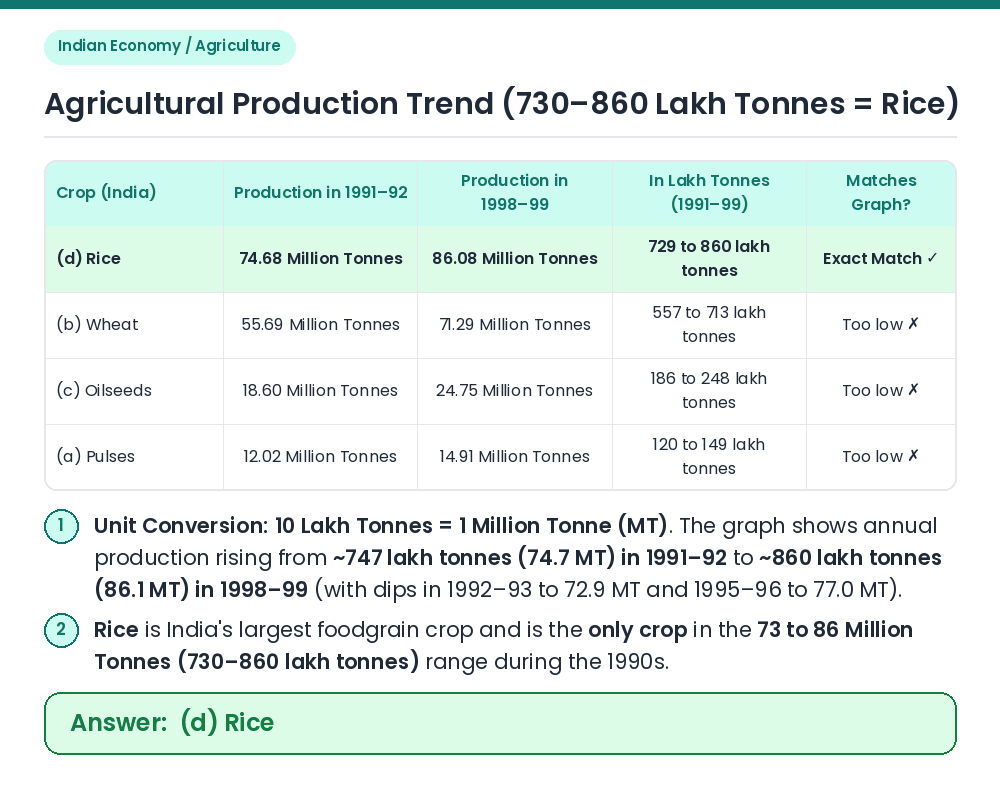
Read the Bar Chart Values: The vertical axis shows production in 'lakh tons' ranging between 729 lakh tonnes (1992–93) and 860 lakh tonnes (1998–99). Since 10 lakh = 1 million, this corresponds to 72.9 million tonnes to 86.0 million tonnes. Compare Crop Production in 1991–92 to 1998–99: ⇒ According to the Ministry of Agriculture / Economic Survey data for 1991–92 to 1998–99: • Rice: 74.7 MT (1991–92), 72.9 MT (1992–93), 80.3 MT (1993–94), 81.8 MT (1994–95), 77.0 MT (1995–96), 81.7 MT (1996–97), 82.5 MT (1997–98), and 86.1 MT (1998–99) — matching every bar in the graph. • Wheat: Ranged from 55.7 MT to 71.3 MT (557 to 713 lakh tonnes). • Oilseeds: Ranged from 18.6 MT to 24.8 MT (186 to 248 lakh tonnes). • Pulses: Ranged from 12.0 MT to 14.9 MT (120 to 149 lakh tonnes). Result: The agricultural product shown in the figure is Rice. Related Facts: • Current Foodgrain Production (2023–24): India's total foodgrain production reached a record ~332.3 million tonnes in 2023–24, with Rice at ~137.8 million tonnes and Wheat at ~113.3 million tonnes. सही उत्तर: (d) Rice