Civil Services Examination · प्रश्न 147
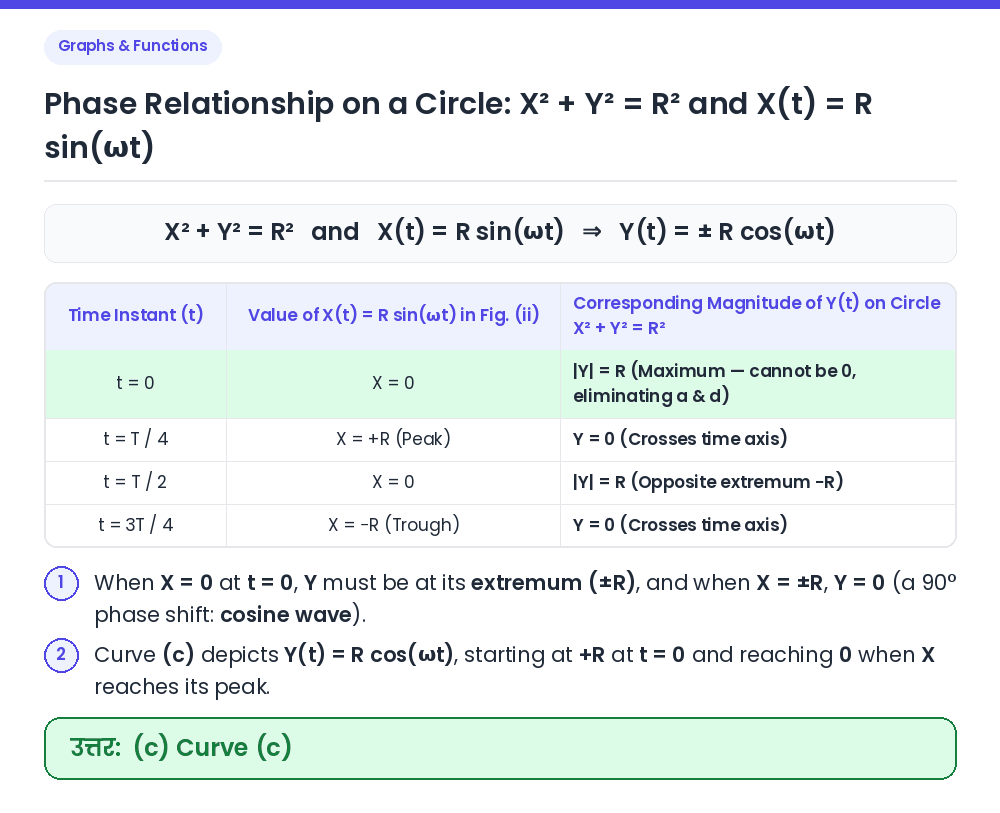
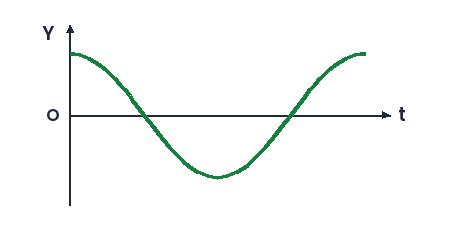
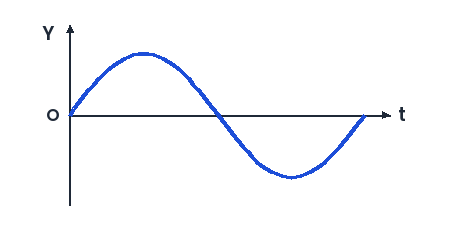
X and Y are two variables whose values at any time are related to each other as shown in Fig. (i). X is known to vary periodically with reference to time as shown in Fig. (ii). Which of the following curves depicts correctly the dependence of Y on time?
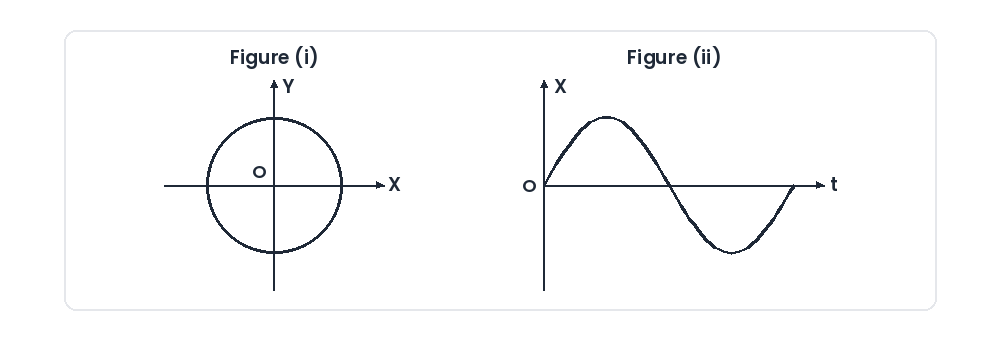
A.
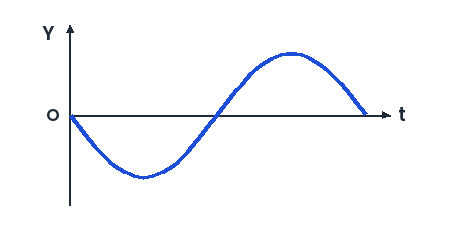
B.
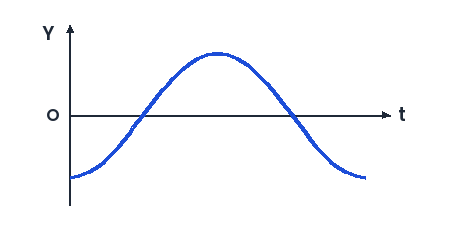
C.
D.
उत्तर देखें और व्याख्याव्याख्या देखें
उत्तर: (C) C
Equations from Fig. i and Fig. ii: Fig. (i) shows that (X, Y) lies on a circle centred at the origin: X² + Y² = R². Fig. (ii) shows that X varies sinusoidally with time t starting from X = 0 at t = 0: X(t) = R sin(ωt). Derive Y as a Function of Time: ⇒ Y² = R² − X² = R²(1 − sin²(ωt)) = R² cos²(ωt) ⇒ For smooth periodic motion around the circle, Y(t) = R cos(ωt). Match Graph Features: At t = 0, X = 0 so Y = +R (maximum); when X reaches its peak (+R) at t = T/4, Y = 0; when X returns to 0 at t = T/2, Y reaches its minimum (−R). This exact cosine curve is shown in option (c). Result: Curve (c) correctly depicts the dependence of Y on time. सही उत्तर: (c) Curve (c)