Civil Services Examination · प्रश्न 19
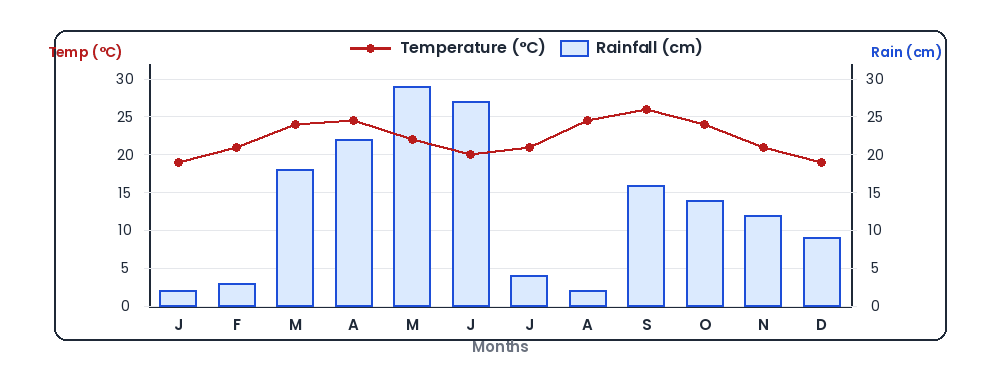
The graph given below shows the mean average monthly temperatures (in °C) and mean monthly rainfall (in cms) of a place: This graph is indicative of which one of the climatic zones of the world?
उत्तर देखें और व्याख्याव्याख्या देखें
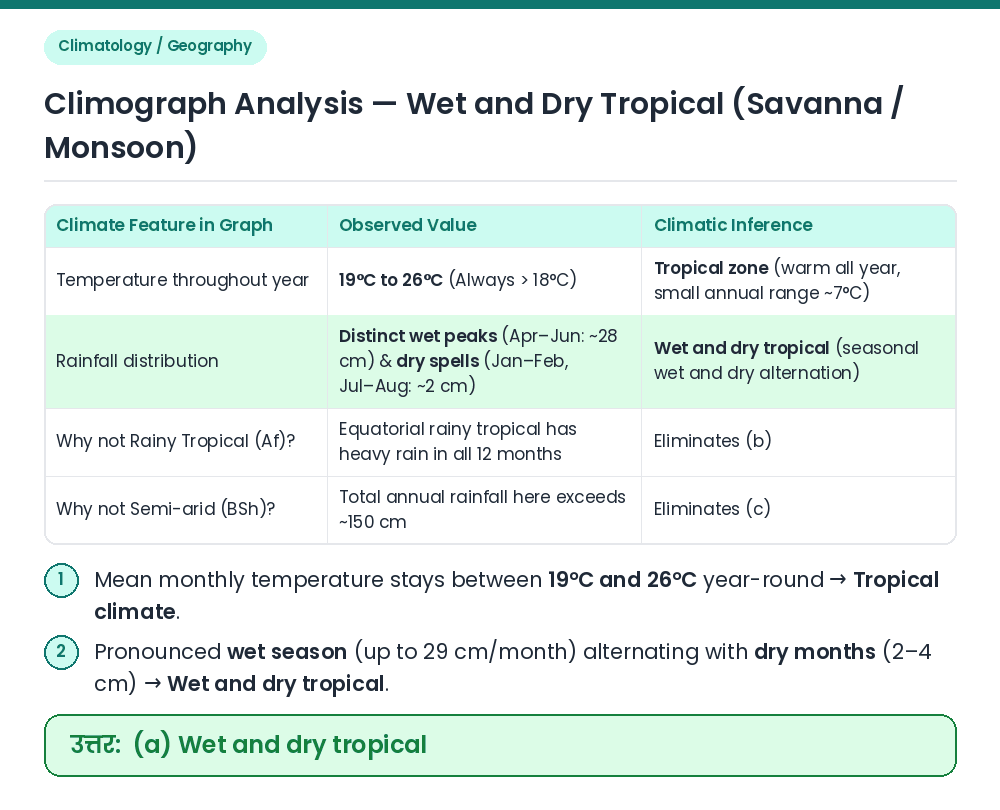
उत्तर: (A) Wet and dry tropical
Read Temperature Curve: The mean monthly temperature stays consistently warm between 19°C and 26°C throughout the year (never falling below 18°C), which confirms a Tropical climate (ruling out Temperate marine). Read Rainfall Bars: Rainfall is strongly seasonal, with heavy monthly peaks of 22–29 cm in April–June and 14–16 cm in September–October, contrasted with distinct dry spells of only 2–4 cm in January–February and July–August. Eliminate Other Tropical Types: Rainy tropical (equatorial Af) lacks a dry season, while Semi-arid tropical (steppe BSh) has much lower total annual rainfall (<50 cm vs ~158 cm here). Result: The graph represents the Wet and dry tropical climatic zone. Related Facts: • In Köppen's classification, Tropical Wet and Dry climate is denoted as 'Aw' (Savanna type). सही उत्तर: (a) Wet and dry tropical