UP Super TET · Question 12
ECG is a graphical representation of the electrical activity of which organ?
Show answer & explanationShow explanation
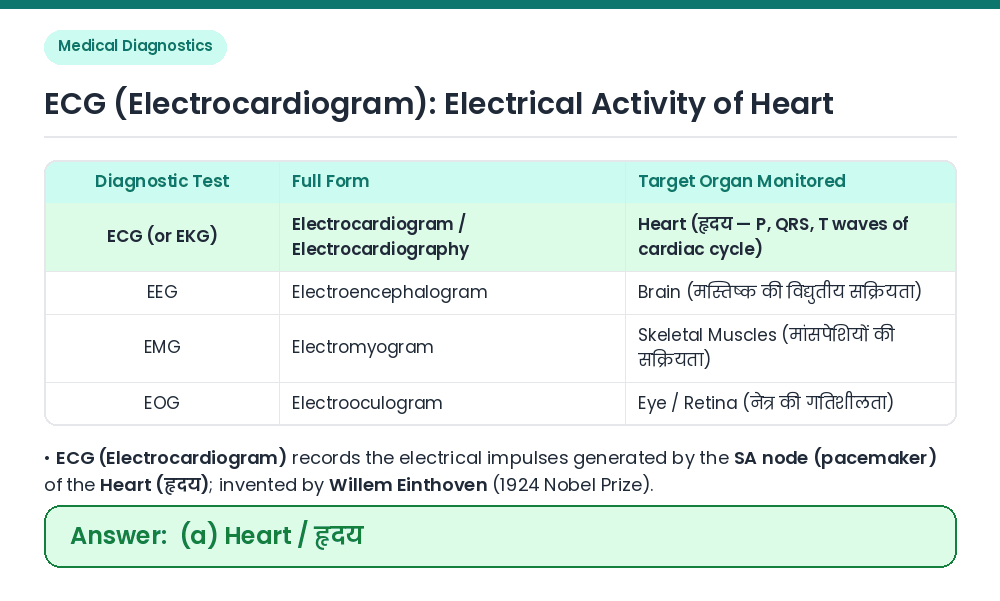
Answer: (A) Heart
An ECG (Electrocardiogram) is a graphical representation of the electrical activity of the Heart (हृदय) during a cardiac cycle. Invented by Dutch physiologist Willem Einthoven (who received the 1924 Nobel Prize in Physiology or Medicine), an ECG traces the P-wave (atrial depolarization), QRS complex (ventricular depolarization), and T-wave (ventricular repolarization) generated by the heart's natural pacemaker (Sino-Atrial node). Why other options are wrong: • (b) Liver: Evaluated using Liver Function Tests (LFT — bilirubin, SGOT, SGPT) and ultrasound. • (c) Kidney: Evaluated using KFT/RFT (creatinine, urea, GFR). • (d) Lungs: Evaluated using Spirometry (Pulmonary Function Test) and Chest X-ray. Related Facts: • Do not confuse ECG with EEG: ECG (Electrocardiogram) measures the electrical activity of the Heart, whereas EEG (Electroencephalogram, invented by Hans Berger) measures the electrical activity of the Brain. • In a standard ECG, the P-wave represents contraction of the atria, the QRS complex represents contraction of the ventricles, and the T-wave represents the return of ventricles from excited to normal state. Correct Answer: (a) Heart