
RRB NTPC · Question 32
Study the graph given below and answer the following questions. One of the graphs below shows the amount invested by the company to purchase unprocessed material in a few years (in lakhs of rupees) and the other shows the values (in lakhs) of processed goods sold by the company in a few years.
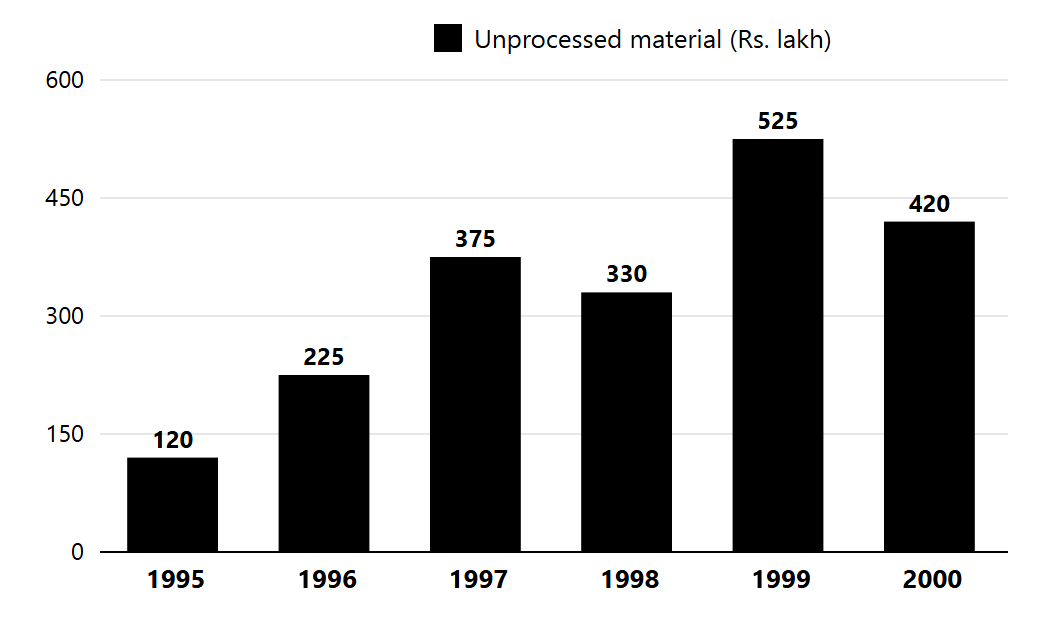
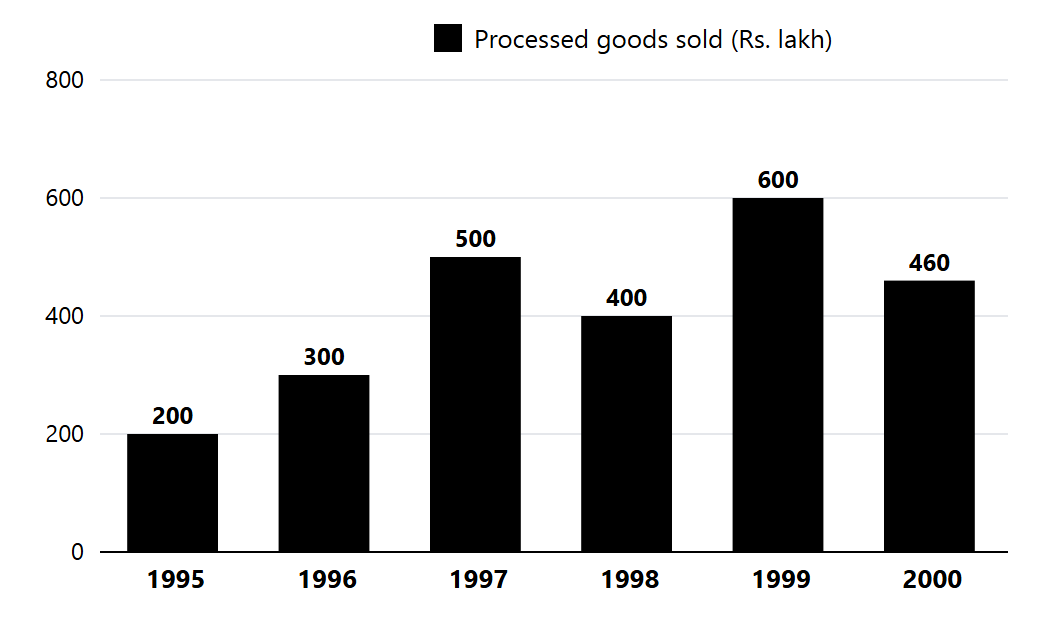
In which year, the percentage change in value invested on unprocessed material (as compared to the previous year) is the same as the value of change in sale of processed goods? A. 1996 B. 1997 C. 1998 D. 1999
Show answer & explanation
Answer: (D) B
Explanation
1997 investment: 225 → 375, a 66.7% rise; 1997 sales: 300 → 500, also 66.7%. In other years the changes differ (e.g. 1996: 87.5% vs 50%; 1998: −12% vs −20%; 1999: 59% vs 50%).