
RRB NTPC · Question 2
The following graph shows the marks obtained by 5 students. Their marks are given out of 10.
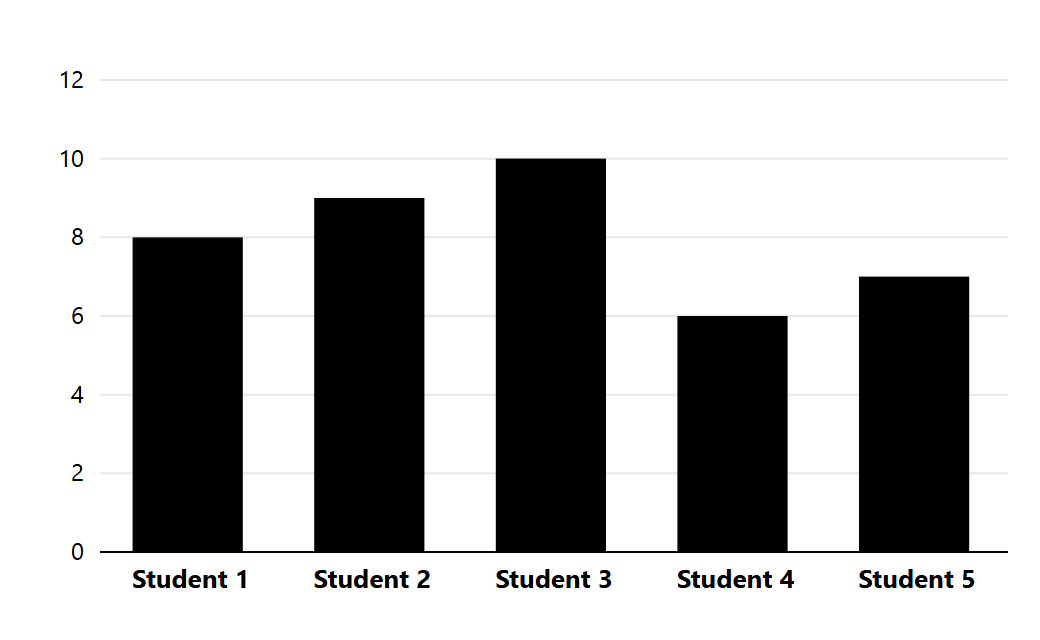
How many more points did students 3 and 5 score than students 4 and 1? A. 2 B. 1 C. 3 D. 4
Show answer & explanation
Answer: (C) C
Explanation
From the graph: Student 1 = 8, Student 3 = 10, Student 4 = 6 and Student 5 = 7. Students 3 and 5 together scored 10 + 7 = 17, and students 4 and 1 scored 6 + 8 = 14. The difference is 17 − 14 = 3 points.