RRB NTPC · Question 33
The following frequency table gives the marks obtained by 48 students in a class test.
| Marks | Frequency |
|---|---|
| 7 | 12 |
| 8 | 13 |
| 9 | 12 |
| 10 | 11 |
With reference to the frequency table, match the following statements: (Values are rounded off to three decimal places.
| Column P | Column Q |
|---|---|
| i. The mean of the distribution | 1. 8.485 |
| ii. The standard deviation of the distribution | 2. 1.207 |
| iii. The variance of the distribution | 3. 1.099 |
Show answer & explanationShow explanation
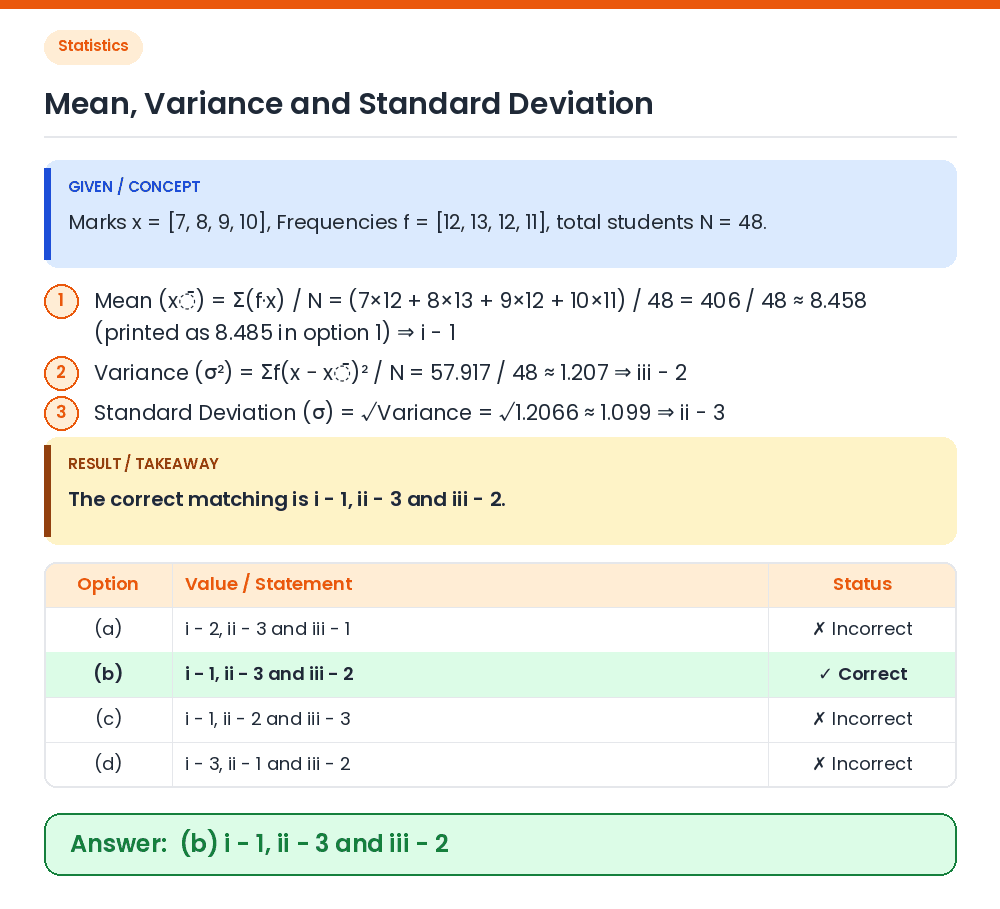
Answer: (B) i - 1, ii - 3 and iii - 2
GIVEN / CONCEPT: Marks x = [7, 8, 9, 10], Frequencies f = [12, 13, 12, 11], total students N = 48. Relation / Equation: Mean (x̄) = Σ(f·x) / N = (7×12 + 8×13 + 9×12 + 10×11) / 48 = 406 / 48 ≈ 8.458 (printed as 8.485 in option 1) ⇒ i - 1 Simplification / Calculation: Variance (σ²) = Σf(x − x̄)² / N = 57.917 / 48 ≈ 1.207 ⇒ iii - 2 Verification / Deduction: Standard Deviation (σ) = √Variance = √1.2066 ≈ 1.099 ⇒ ii - 3 RESULT / TAKEAWAY: The correct matching is i - 1, ii - 3 and iii - 2. Correct Answer: (b) i - 1, ii - 3 and iii - 2