SSC CGL – Combined Graduate Level Examination · Question 73
The following table shows the sales of cars of five manufacturers from 2016 to 2020. (All the figures are in hundreds.)
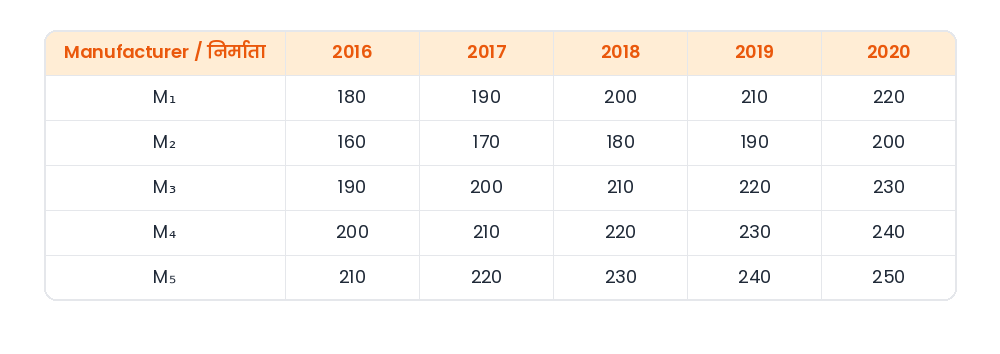
Manufacturer — 2016 — 2017 — 2018 — 2019 — 2020 M₁ — 180 — 190 — 200 — 210 — 220 M₂ — 160 — 170 — 180 — 190 — 200 M₃ — 190 — 200 — 210 — 220 — 230 M₄ — 200 — 210 — 220 — 230 — 240 M₅ — 210 — 220 — 230 — 240 — 250 What is the difference between the total number of sales of manufacturer M₂ and the total number of sales of manufacturer M₄ during the years 2016 to 2019?
Show answer & explanationShow explanation
Answer: (B) 16000
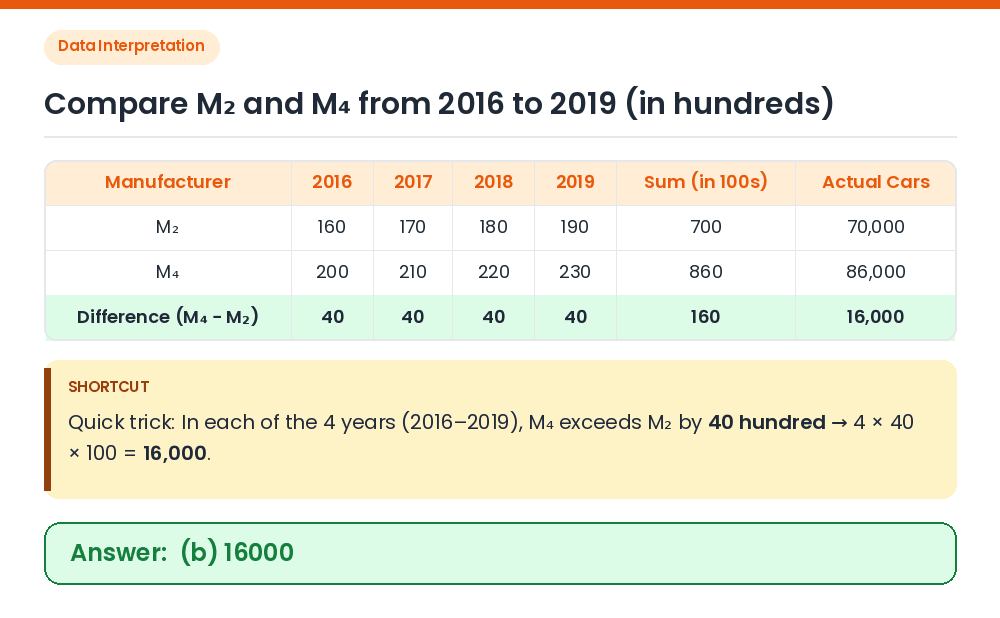
Sales of M₂ from 2016 to 2019: 160 + 170 + 180 + 190 = 700 (in hundreds) = 70,000. Sales of M₄ from 2016 to 2019: 200 + 210 + 220 + 230 = 860 (in hundreds) = 86,000. Difference: 86,000 − 70,000 = 16,000. Shortcut: In each of the 4 years, M₄ − M₂ = 40 hundred → 4 × 40 × 100 = 16,000. Correct Answer: (b) 16000