SSC CGL – Combined Graduate Level Examination · Question 74
The given table shows the production of iron rods by a company for a period of 6 months. Study the table and answer the question that follows.
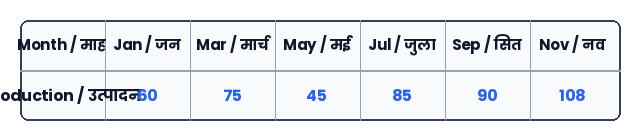
What is the ratio of the month having the highest production to the month having the least production?
Show answer & explanationShow explanation
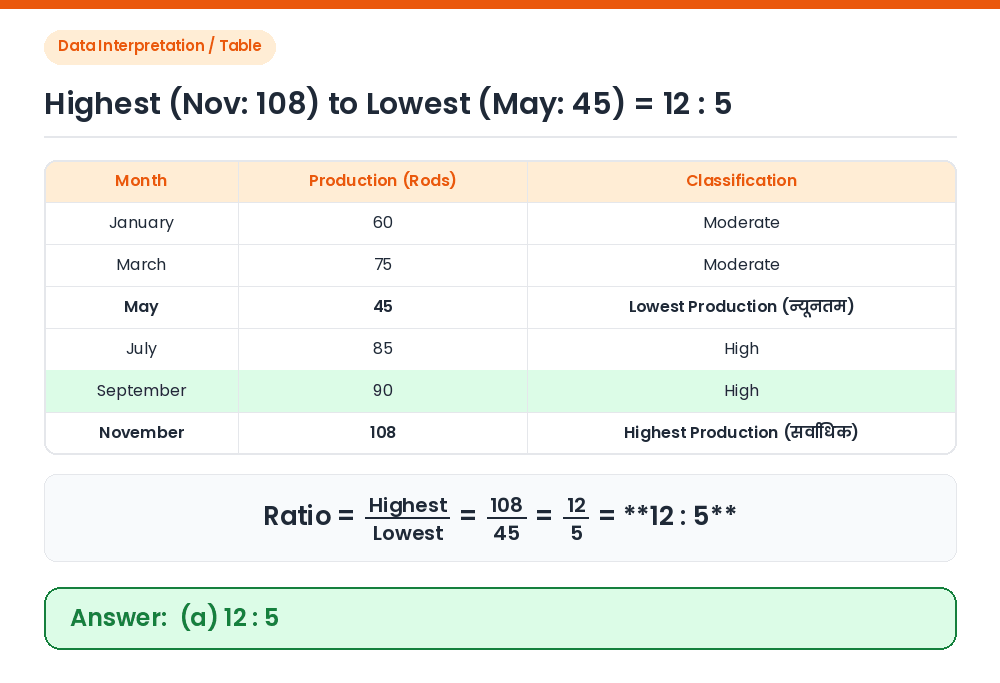
Answer: (A) 12 : 5
Identify highest production month: From the table, November has the highest production = 108. Identify lowest production month: From the table, May has the lowest production = 45. Calculate ratio: Highest : Lowest = 108 : 45. Dividing both by 9 gives 12 : 5. Correct Answer: (a) 12 : 5