SSC CGL – Combined Graduate Level Examination · Question 57
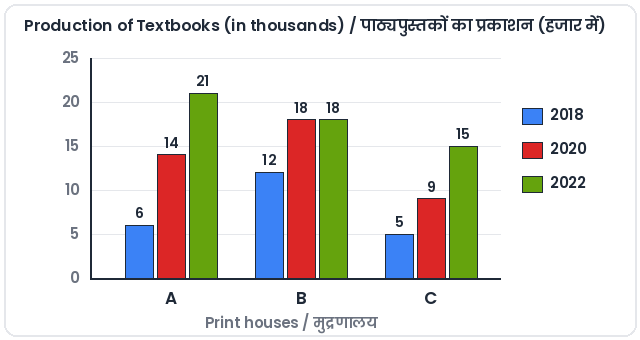
Study the given chart and answer the question that follows. The following chart shows the production of textbooks in thousands in the years 2018, 2020 and 2022 from the print houses A, B and C, respectively. The ratio of textbooks produced by Print house B in the year 2018 to the textbooks produced by Print house C in the year 2020 is ______.
Show answer & explanationShow explanation
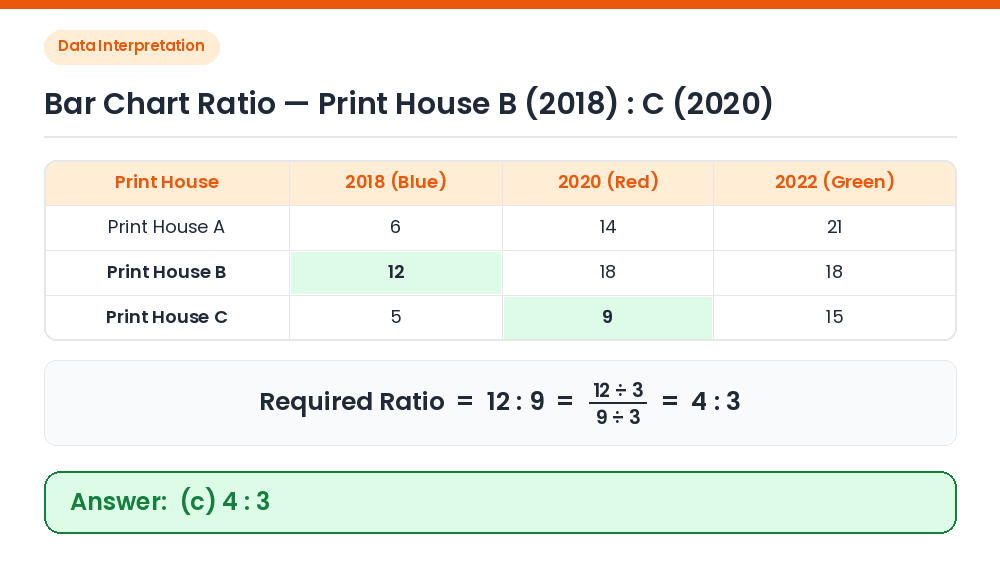
Answer: (C) 4 : 3
Read values from the bar chart: • Textbooks produced by Print house B in 2018 (blue bar) = 12 thousand. • Textbooks produced by Print house C in 2020 (red bar) = 9 thousand. Find the simplified ratio: 12 : 9 = (12 ÷ 3) : (9 ÷ 3) = 4 : 3. Correct Answer: (c) 4 : 3