SSC CGL – Combined Graduate Level Examination · Question 51
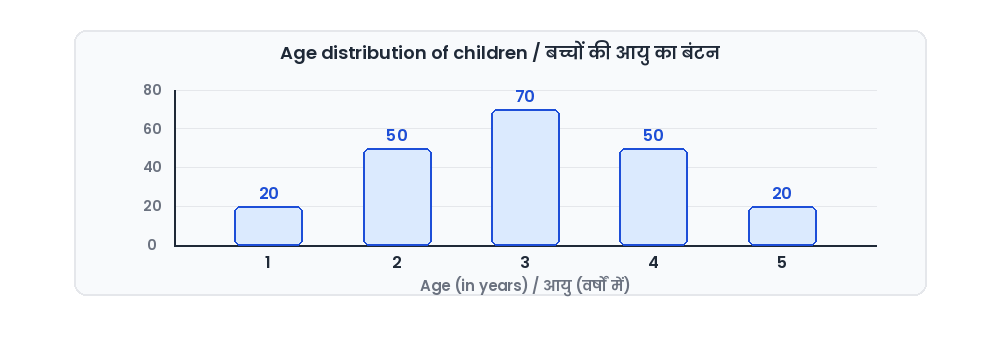
The given graph represents the data on the ages of various children. Study the given graph and answer the question that follows. What is the difference between the mean and mode of the ages?
Show answer & explanationShow explanation
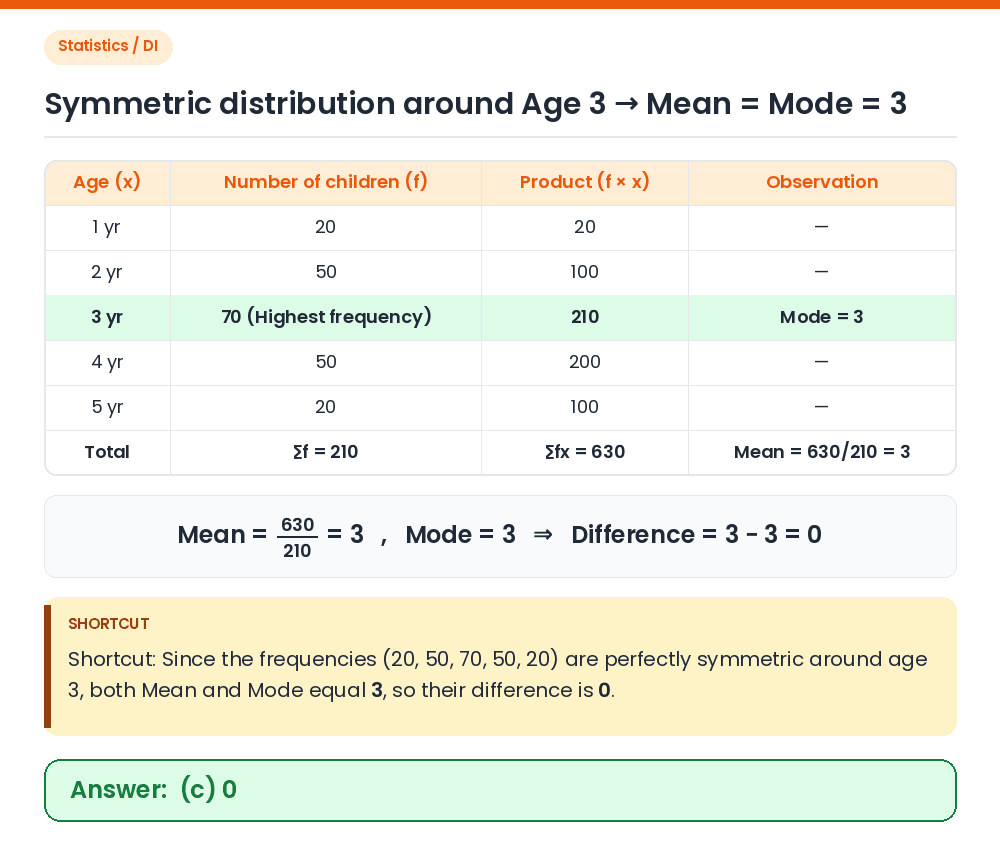
Answer: (C) 0
Find the Mode: The highest bar (maximum number of children = 70) corresponds to age 3 years, so Mode = 3. Find the Mean: Total children (∑f) = 20 + 50 + 70 + 50 + 20 = 210. Sum of ages (∑fx) = 1(20) + 2(50) + 3(70) + 4(50) + 5(20) = 20 + 100 + 210 + 200 + 100 = 630. Mean = 630 / 210 = 3. Difference: Mean − Mode = 3 − 3 = 0. Shortcut: Because the distribution is perfectly symmetric around age 3, Mean = Mode = 3, giving difference = 0. Correct Answer: (c) 0