SSC CGL – Combined Graduate Level Examination · Question 55
The table shows the production of different types of bikes (in thousands).
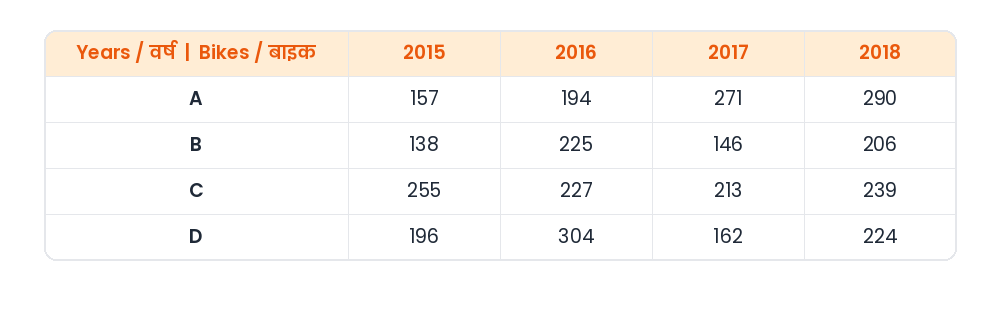
Years : 2015 | 2016 | 2017 | 2018 Bike A : 157 | 194 | 271 | 290 Bike B : 138 | 225 | 146 | 206 Bike C : 255 | 227 | 213 | 239 Bike D : 196 | 304 | 162 | 224 The number of years, in which the production of bikes of type C is less than the average production of type A bikes over the years is
Show answer & explanationShow explanation
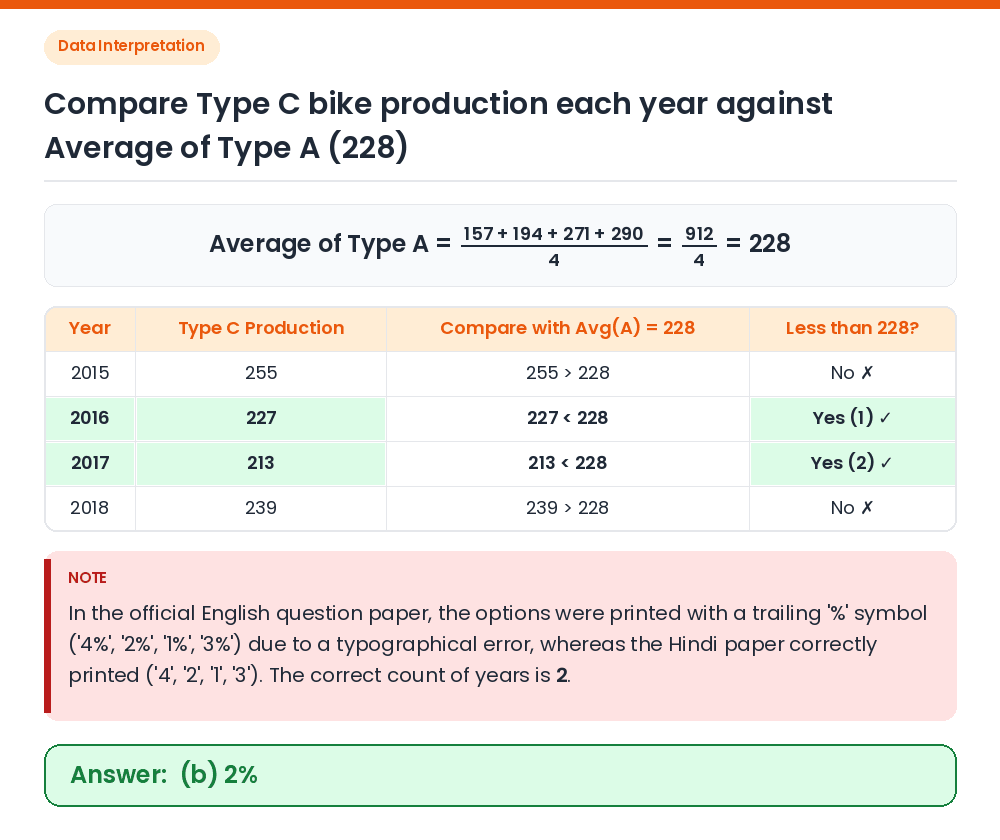
Answer: (B) 2%
Average production of type A bikes: (157 + 194 + 271 + 290) ÷ 4 = 912 ÷ 4 = 228 (thousand). Compare type C production in each year with 228: • 2015: 255 > 228 • 2016: 227 < 228 ✓ • 2017: 213 < 228 ✓ • 2018: 239 > 228 Count of years: In 2 years (2016 and 2017), the production of type C bikes is less than 228. (Note: The official English paper printed '%' symbols in the options—'4%', '2%', '1%', '3%'—whereas the Hindi paper correctly printed '4', '2', '1', '3'. Option (b) representing 2 is the official key.) Correct Answer: (b) 2%