SSC CGL – Combined Graduate Level Examination · Question 64
The given bar graph shows the actual production and targeted production of electric cars from 2019 to 2022. Study the given bar graph and answer the question that follows.
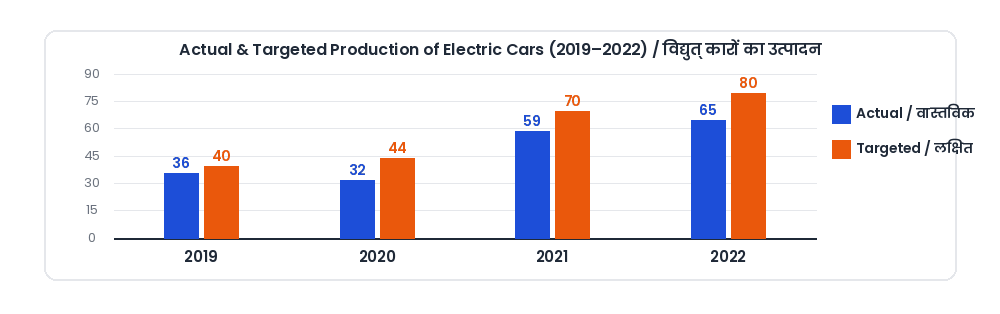
2019: Actual = 36, Targeted = 40 2020: Actual = 32, Targeted = 44 2021: Actual = 59, Targeted = 70 2022: Actual = 65, Targeted = 80 What is the ratio of the total targeted production of cars in 2021 and 2022 to the actual production of cars from 2019 to 2022 taken together?
Show answer & explanationShow explanation
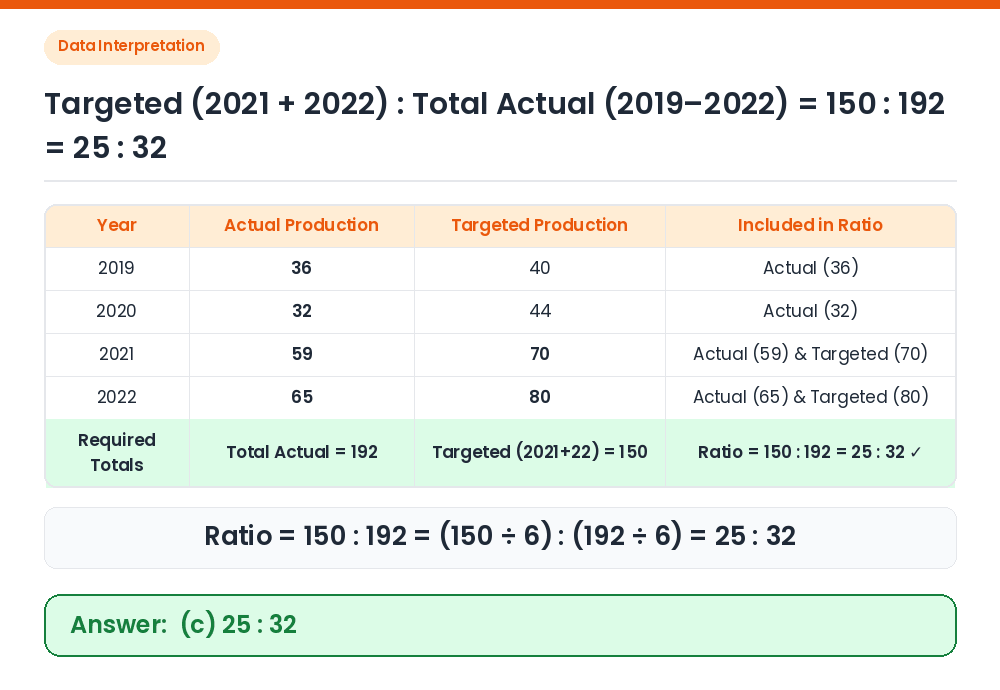
Answer: (C) 25 : 32
Targeted production in 2021 and 2022: 70 + 80 = 150. Total actual production from 2019 to 2022: 36 + 32 + 59 + 65 = 192. Simplify the ratio: 150 : 192. Dividing both terms by 6 gives 25 : 32. Correct Answer: (c) 25 : 32