SSC CGL – Combined Graduate Level Examination · Question 55
Study the given table and answer the question. The table displays the number of cars produced (in lakhs) by six different brands between 2018 and 2023.
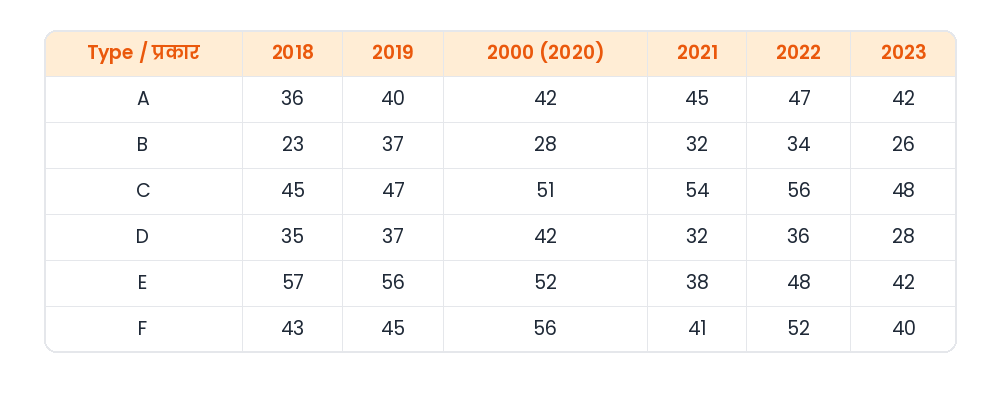
Type — 2018 — 2019 — 2000 — 2021 — 2022 — 2023 A — 36 — 40 — 42 — 45 — 47 — 42 B — 23 — 37 — 28 — 32 — 34 — 26 C — 45 — 47 — 51 — 54 — 56 — 48 D — 35 — 37 — 42 — 32 — 36 — 28 E — 57 — 56 — 52 — 38 — 48 — 42 F — 43 — 45 — 56 — 41 — 52 — 40 Find the difference in the average production of B and D during 2018-2023.
Show answer & explanationShow explanation
Answer: (C) 5 lakhs
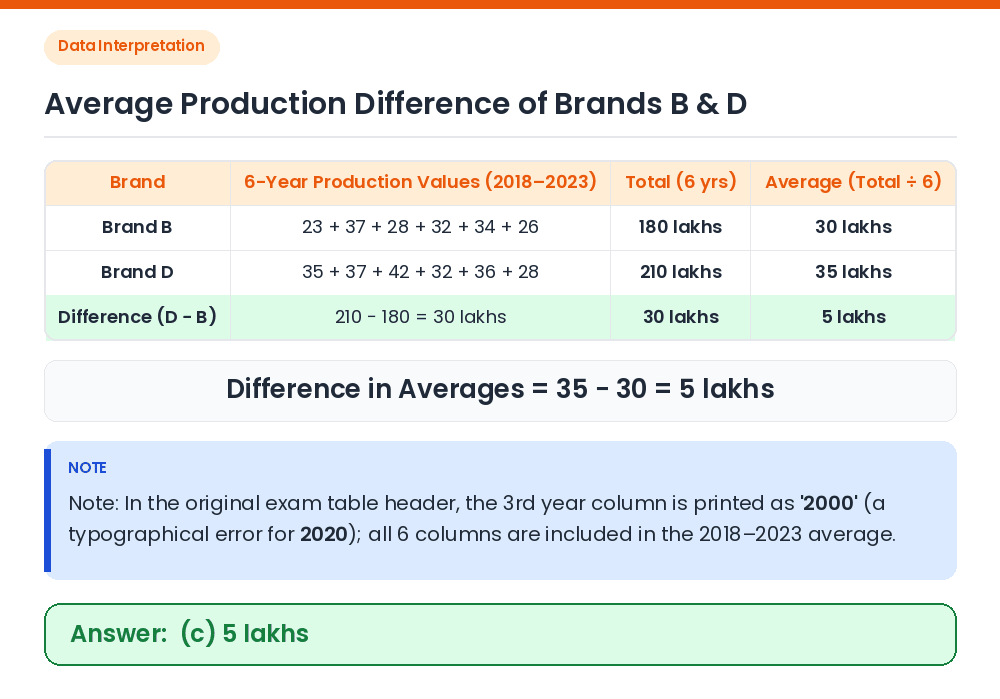
Total production of B over the 6 years: 23 + 37 + 28 + 32 + 34 + 26 = 180 lakhs. Average of B = 180 / 6 = 30 lakhs. Total production of D over the 6 years: 35 + 37 + 42 + 32 + 36 + 28 = 210 lakhs. Average of D = 210 / 6 = 35 lakhs. Difference in average production: 35 − 30 = 5 lakhs. (Note: In the official question paper, the column header for 2020 is misprinted as '2000'; all 6 columns are used for the 2018–2023 average.) Correct Answer: (c) 5 lakhs