SSC CGL – Combined Graduate Level Examination · Question 75
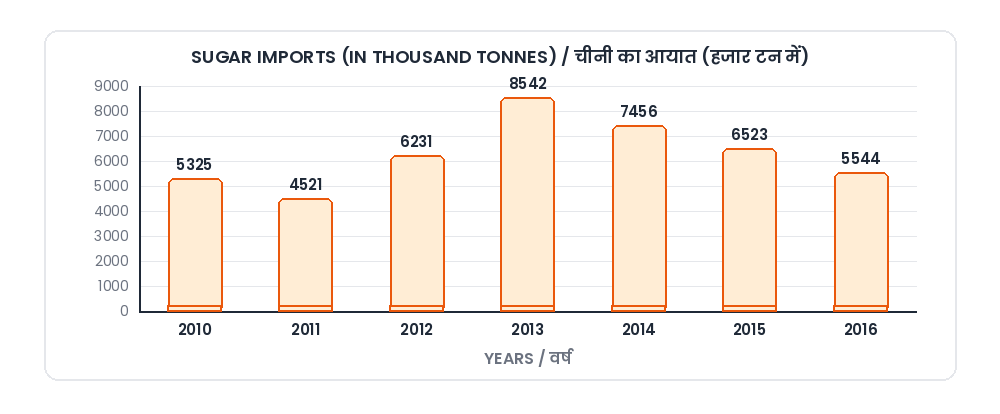
The given bar graph shows sugar imports of a country (in thousand tonnes) over the years. Study the graph and answer the question that follows. (Years 2010 to 2016: 5325, 4521, 6231, 8542, 7456, 6523, 5544) The average imports (in thousand tonnes) of all the years is:
Show answer & explanationShow explanation
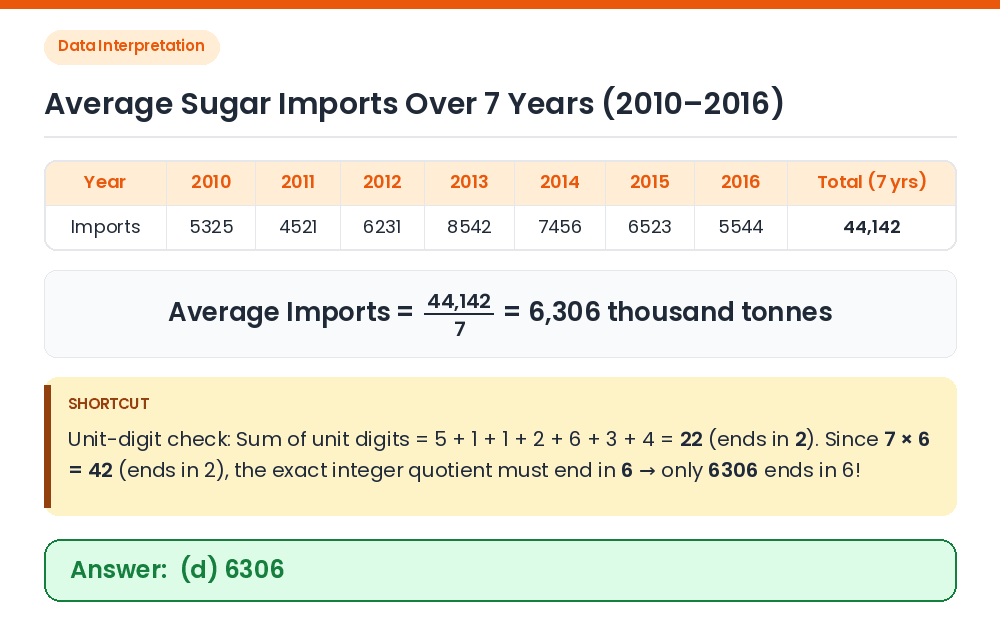
Answer: (D) 6306
Sum the imports for all 7 years from 2010 to 2016: 5325 + 4521 + 6231 + 8542 + 7456 + 6523 + 5544 = 44,142 thousand tonnes. Divide by the number of years = 7: Average = 44,142 / 7 = 6,306 thousand tonnes. Shortcut (Unit-digit check): The sum ends in 2 (5+1+1+2+6+3+4 = 22), and dividing by 7 requires a quotient ending in 6 (since 7 × 6 = 42). Only option (d) 6306 ends in 6. Correct Answer: (d) 6306