SSC CGL – Combined Graduate Level Examination · Question 59
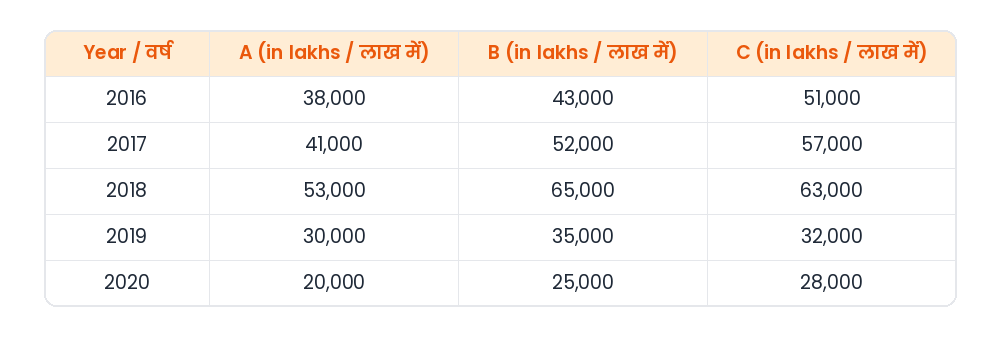
The below table shows the number of 1 litre bottles of soft drink produced by three companies during 2016-2020. Study the given information carefully and answer the question that follows. Year — A (in lakhs) — B (in lakhs) — C (in lakhs) 2016 — 38,000 — 43,000 — 51,000 2017 — 41,000 — 52,000 — 57,000 2018 — 53,000 — 65,000 — 63,000 2019 — 30,000 — 35,000 — 32,000 2020 — 20,000 — 25,000 — 28,000 What is the difference in average production of A and C during 2016-2018 (in lakhs)?
Show answer & explanationShow explanation
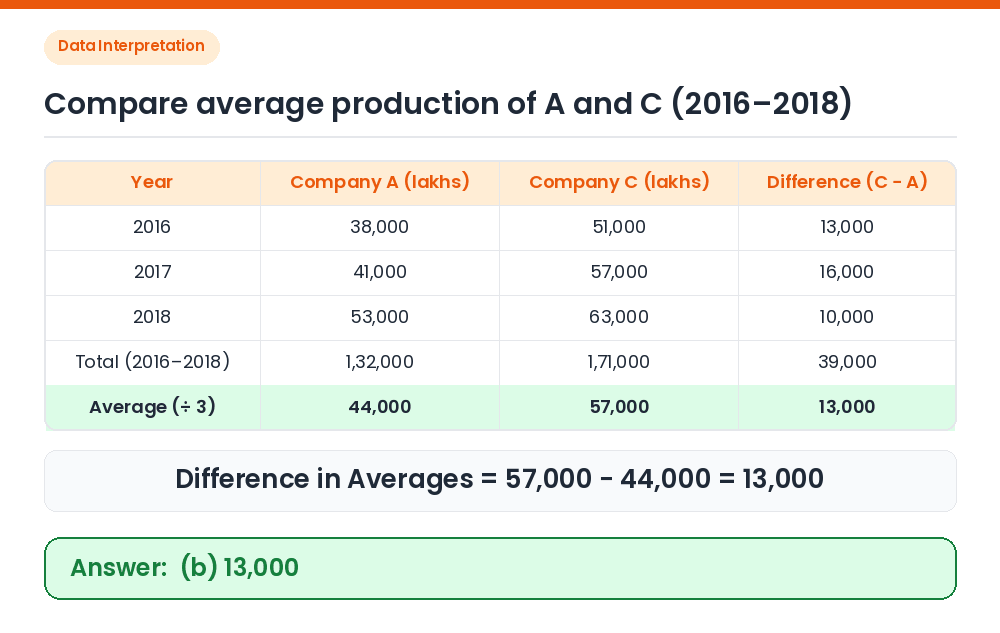
Answer: (B) 13,000
Average of A for 2016–2018: (38,000 + 41,000 + 53,000) / 3 = 1,32,000 / 3 = 44,000. Average of C for 2016–2018: (51,000 + 57,000 + 63,000) / 3 = 1,71,000 / 3 = 57,000. Difference: 57,000 − 44,000 = 13,000. Correct Answer: (b) 13,000