SSC CGL – Combined Graduate Level Examination · Question 57
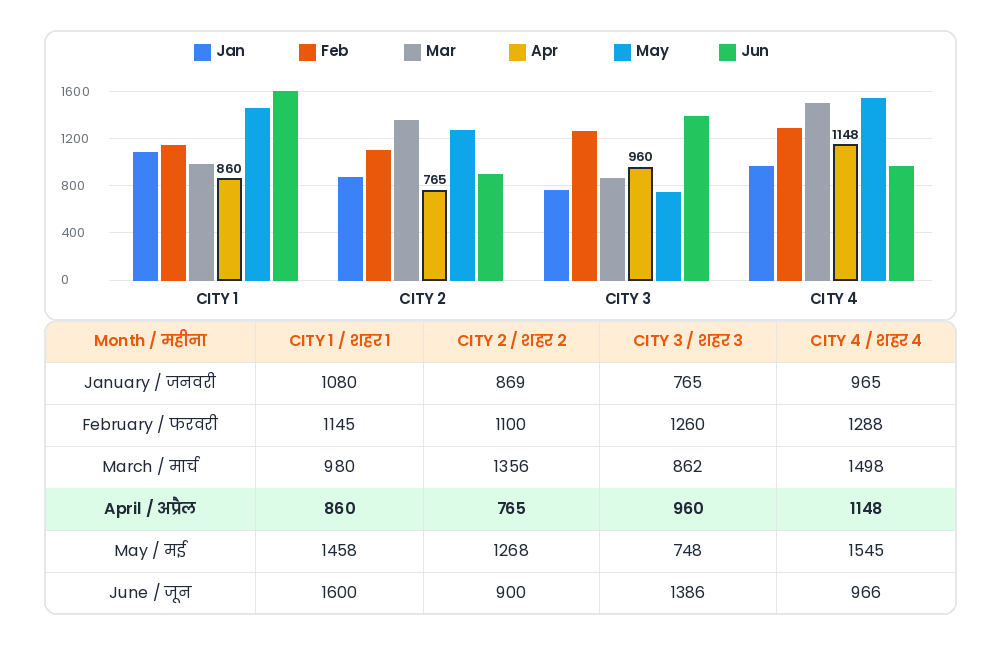
Study the given bar graph and answer the question that follows. The following bar graph shows the number of deaths that happened in cities 1, 2, 3 and 4 in the months mentioned. City 1: Jan=1080, Feb=1145, Mar=980, Apr=860, May=1458, Jun=1600 City 2: Jan=869, Feb=1100, Mar=1356, Apr=765, May=1268, Jun=900 City 3: Jan=765, Feb=1260, Mar=862, Apr=960, May=748, Jun=1386 City 4: Jan=965, Feb=1288, Mar=1498, Apr=1148, May=1545, Jun=966 The average number of deaths that occurred during April across all the cities (rounded off to the next integer) is:
Show answer & explanationShow explanation
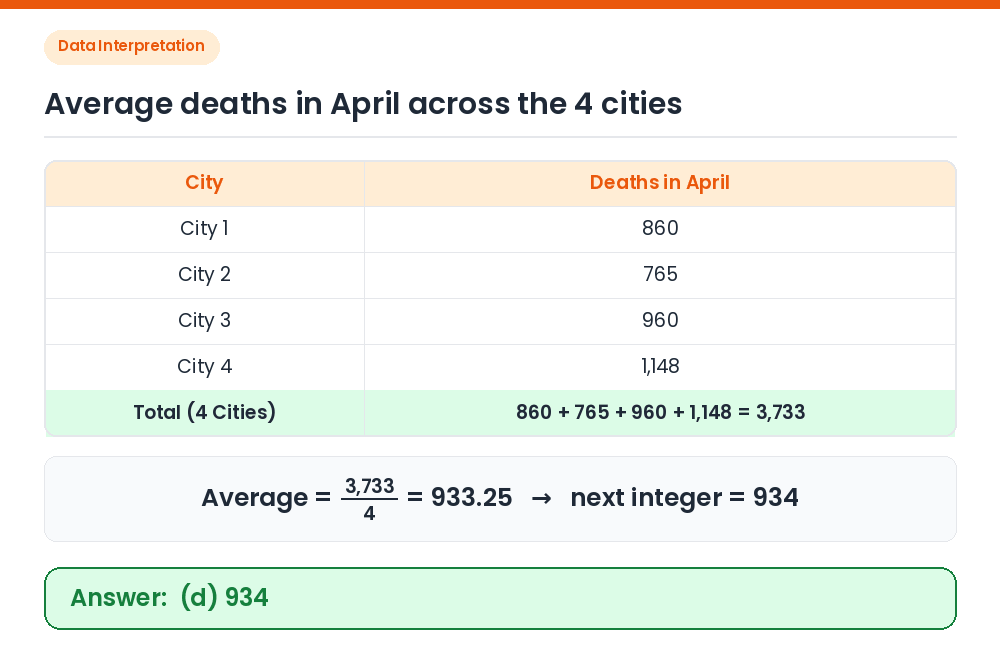
Answer: (D) 934
Read April values from the bar graph: City 1 = 860, City 2 = 765, City 3 = 960, City 4 = 1,148. Find total deaths in April: 860 + 765 + 960 + 1,148 = 3,733. Calculate the average: 3,733 ÷ 4 = 933.25. Round to the next integer: Rounding 933.25 up to the next integer gives 934. Correct Answer: (d) 934