SSC CGL – Combined Graduate Level Examination · Question 66
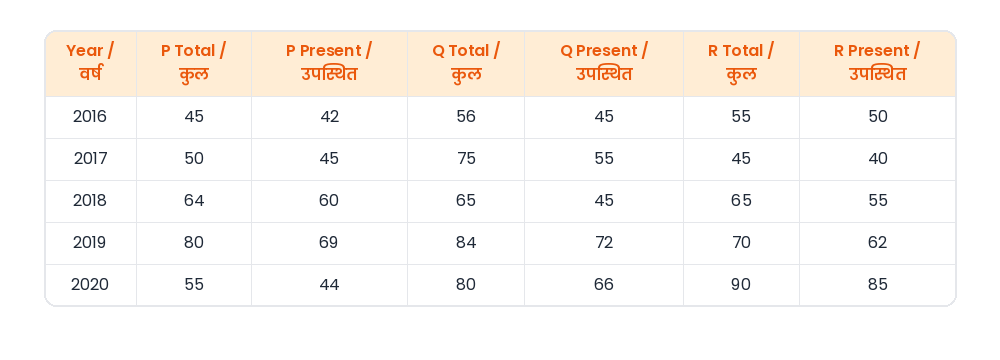
The following table shows the total candidates appeared and number of candidates present, in different exam centres – P, Q and R. Study the table and answer the question that follows. 'Total' denotes total candidates applied for the centre, 'Present' denotes the candidates appeared. In which year was the number of absentees the second highest in total of all centres?
Show answer & explanationShow explanation
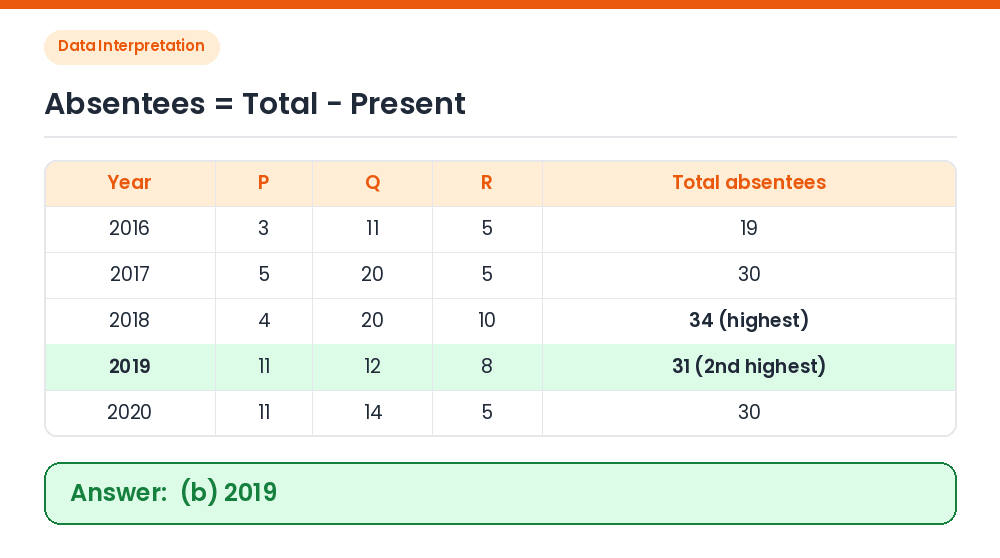
Answer: (B) 2019
Absentees each year: 2016: 3 + 11 + 5 = 19; 2017: 5 + 20 + 5 = 30; 2018: 4 + 20 + 10 = 34; 2019: 11 + 12 + 8 = 31; 2020: 11 + 14 + 5 = 30. Rank: Highest = 2018 (34); second highest = 2019 (31). Correct Answer: (b) 2019