SSC CGL – Combined Graduate Level Examination · Question 61
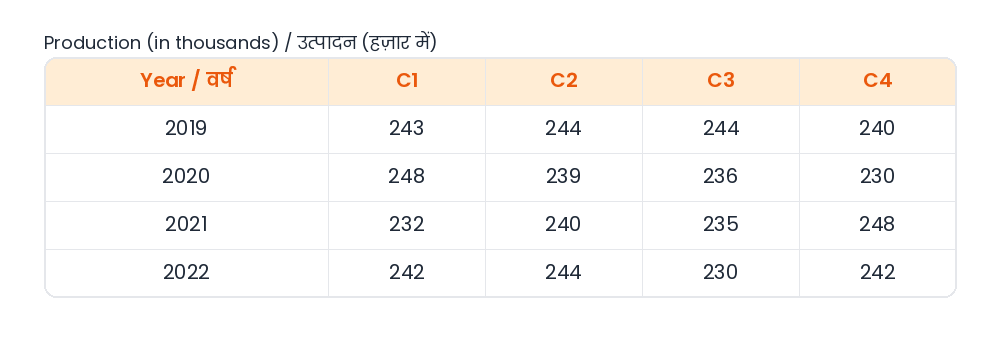
Study the given table and answer the question that follows. The given table shows the production of T-shirts (in thousands) by four companies i.e., C1, C2, C3 and C4 over the four years. Which company had the maximum average production of T-shirts during these four years?
Show answer & explanationShow explanation
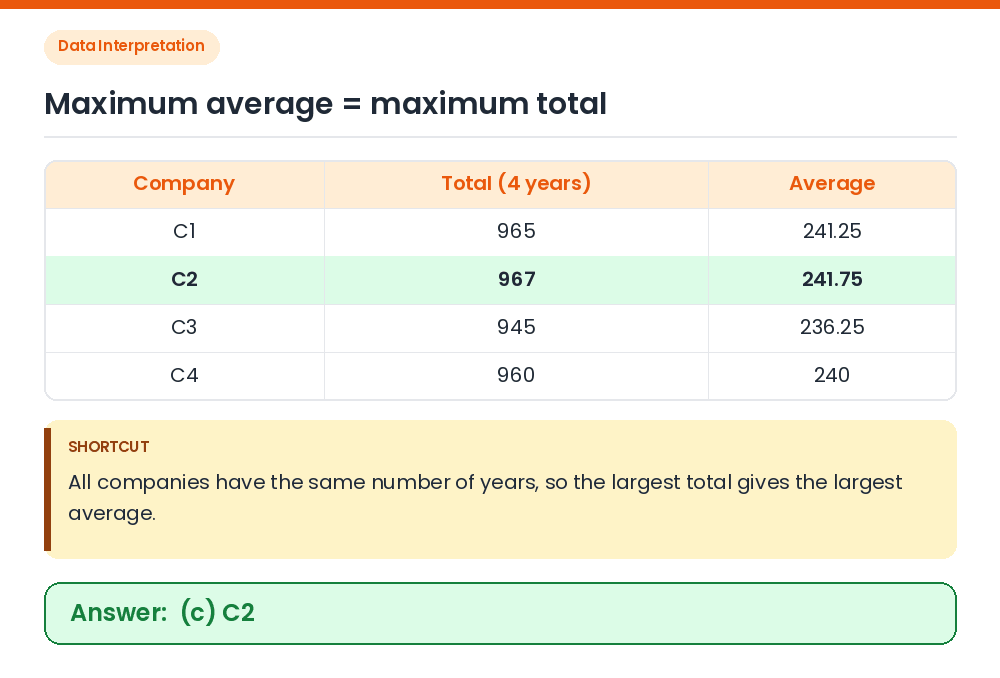
Answer: (C) C2
Totals: C1 = 243 + 248 + 232 + 242 = 965; C2 = 244 + 239 + 240 + 244 = 967; C3 = 244 + 236 + 235 + 230 = 945; C4 = 240 + 230 + 248 + 242 = 960. Compare: The number of years is the same, so the highest total (C2 = 967, average 241.75) gives the highest average. Correct Answer: (c) C2