SSC CHSL – Combined Higher Secondary (10+2) Level Examination · Question 91
In Microeconomics, the graphical representation of the supply function is known as the:
Show answer & explanationShow explanation
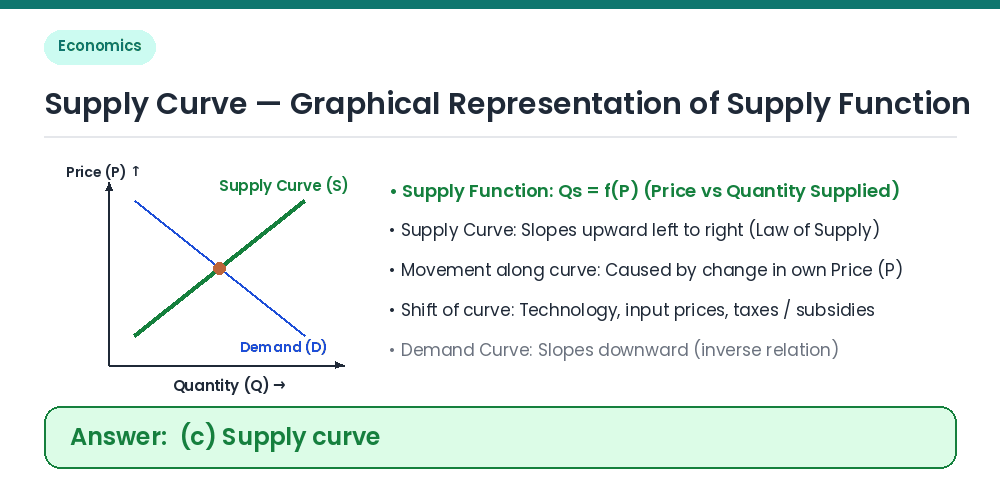
Answer: (C) Supply curve
Definition: The supply function expresses the relationship between the price of a good (P) and the quantity supplied (Qs). Its graphical representation is called the Supply curve. Slope & Law of Supply: With price on the Y-axis and quantity on the X-axis, the supply curve slopes upward from left to right, reflecting the Law of Supply (higher price leads to greater quantity supplied, ceteris paribus). Other options: Demand curve — graphical representation of the demand function (downward sloping); Cost curve — relates cost to output; Revenue curve — relates revenue to output. Correct Answer: (c) Supply curve