SSC MTS – Multi-Tasking (Non-Technical) Staff & Havaldar Examination · Question 11
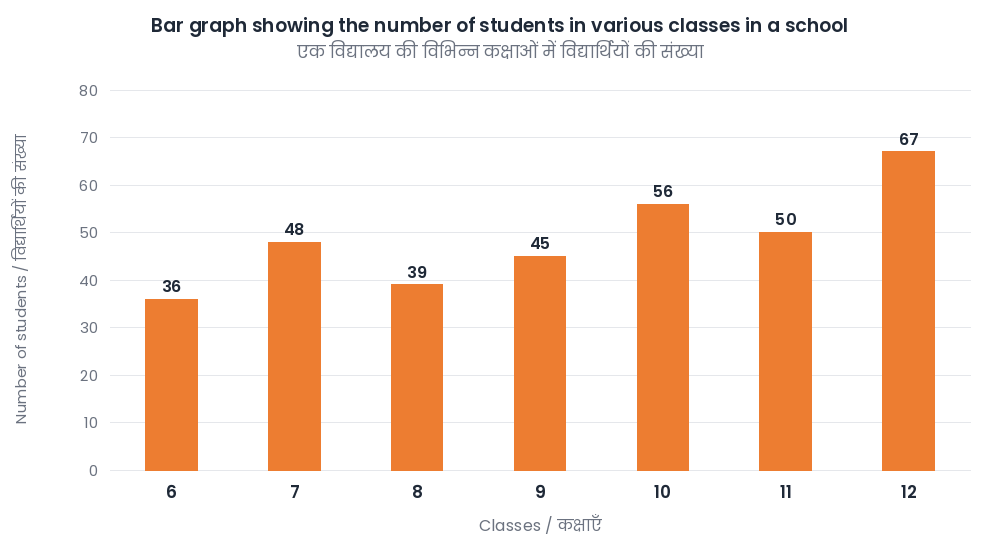
The bar graph below shows the number of students in various classes in a school. Study the graph below and answer the following question: What is the ratio of the average number of students in classes 8, 9, 11, and 12 to the average number of students in classes 6, 7, 8, 9, 10 and 12? (The question is printed as an image in the English paper; it is typed here.)
Show answer & explanationShow explanation
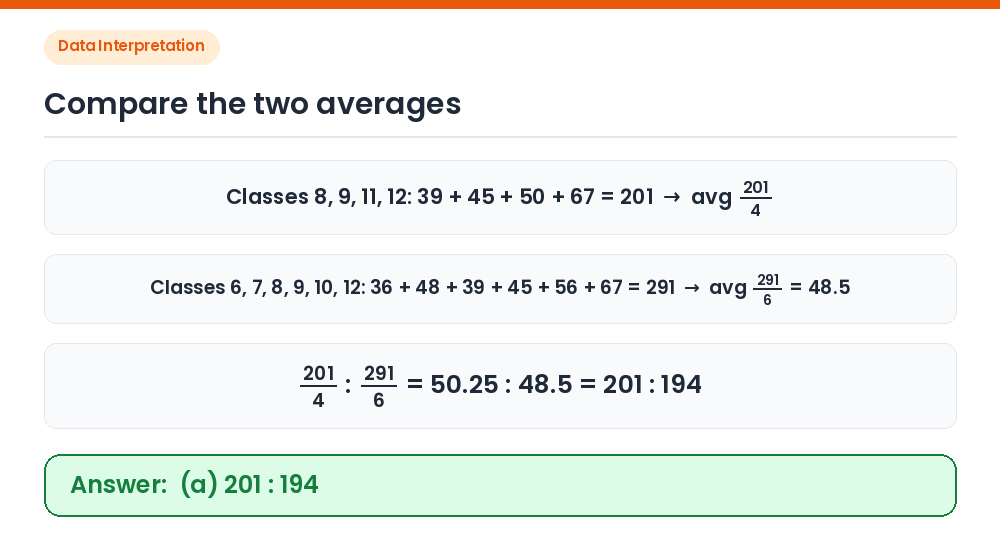
Answer: (A) 201 : 194
First group: Classes 8, 9, 11, 12: 39 + 45 + 50 + 67 = 201; average = 201/4 = 50.25. Second group: Classes 6, 7, 8, 9, 10, 12: 36 + 48 + 39 + 45 + 56 + 67 = 291; average = 291/6 = 48.5. Ratio: 50.25 : 48.5 = 201 : 194. Correct Answer: (a) 201 : 194