SSC MTS – Multi-Tasking (Non-Technical) Staff & Havaldar Examination · Question 3
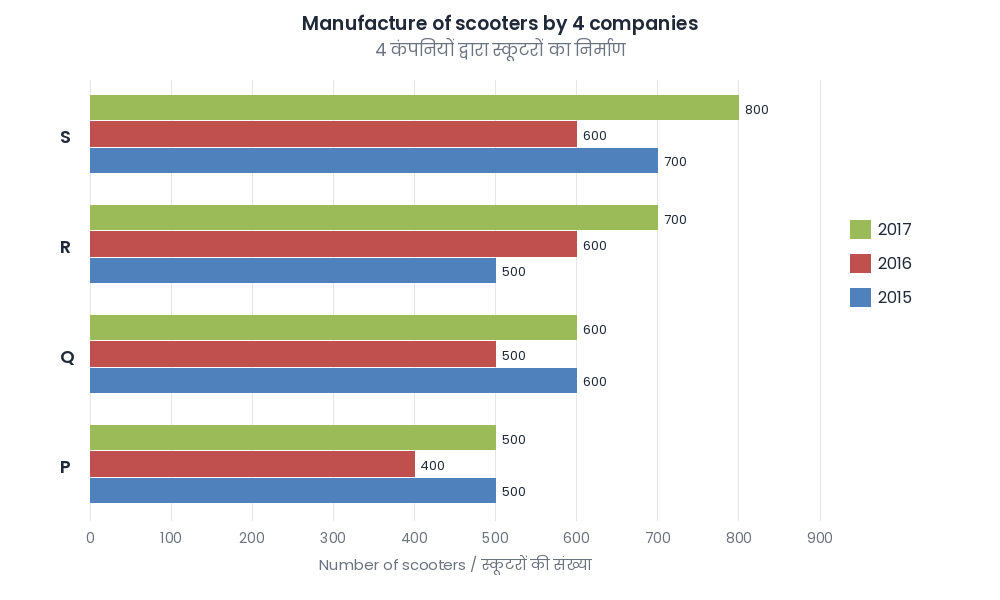
The following bar graph shows the number of scooters manufactured by 4 different companies, P, Q, R and S, during the years 2015 - 2017. The x - axis indicates the number of scooters manufactured and the y - axis indicates the companies. Study the bar graph carefully and answer the question that follows. In which year(s) was the percentage increase in the manufacturing of scooters as compared to the previous years the maximum for the company R?
Show answer & explanationShow explanation
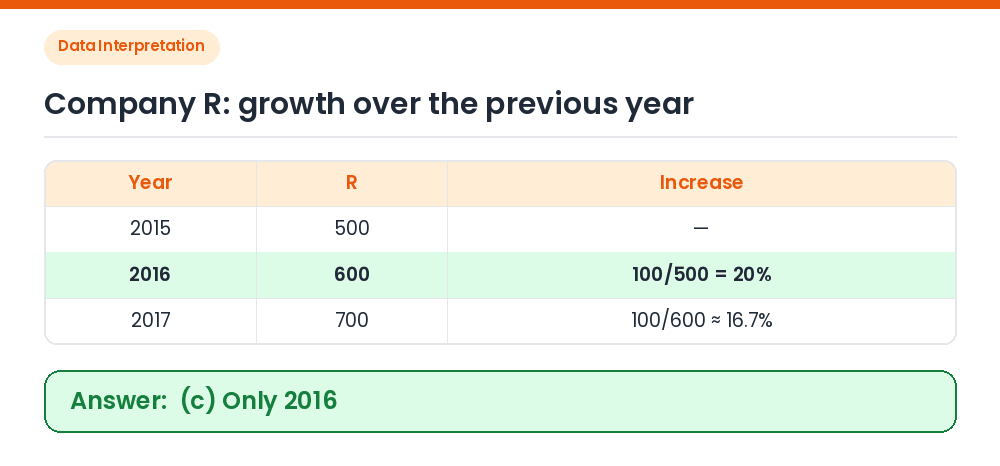
Answer: (C) Only 2016
Read R: 2015 = 500, 2016 = 600, 2017 = 700. 2016: (600 − 500)/500 × 100 = 20%. 2017: (700 − 600)/600 × 100 ≈ 16.7%. The increase is largest in 2016 only. Correct Answer: (c) Only 2016