SSC MTS – Multi-Tasking (Non-Technical) Staff & Havaldar Examination · Question 6
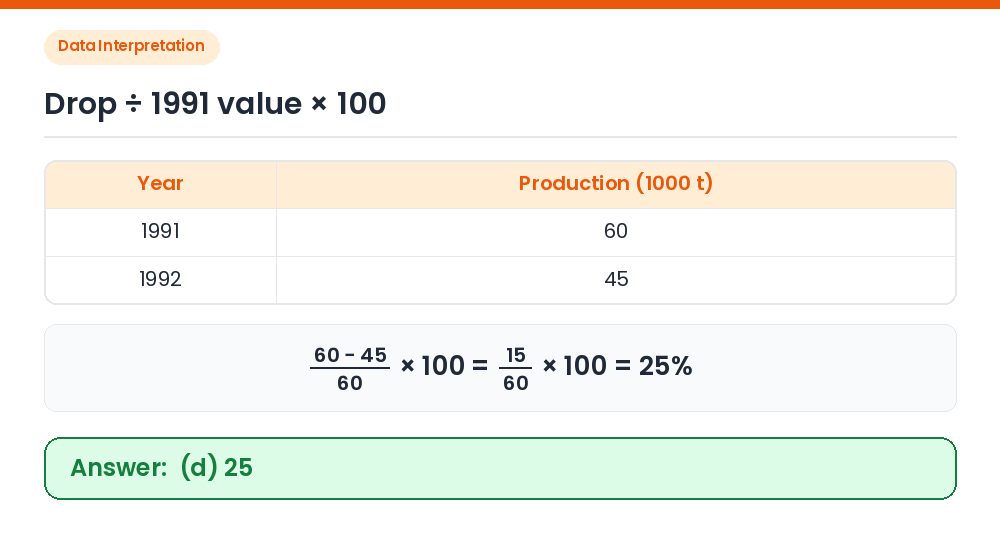
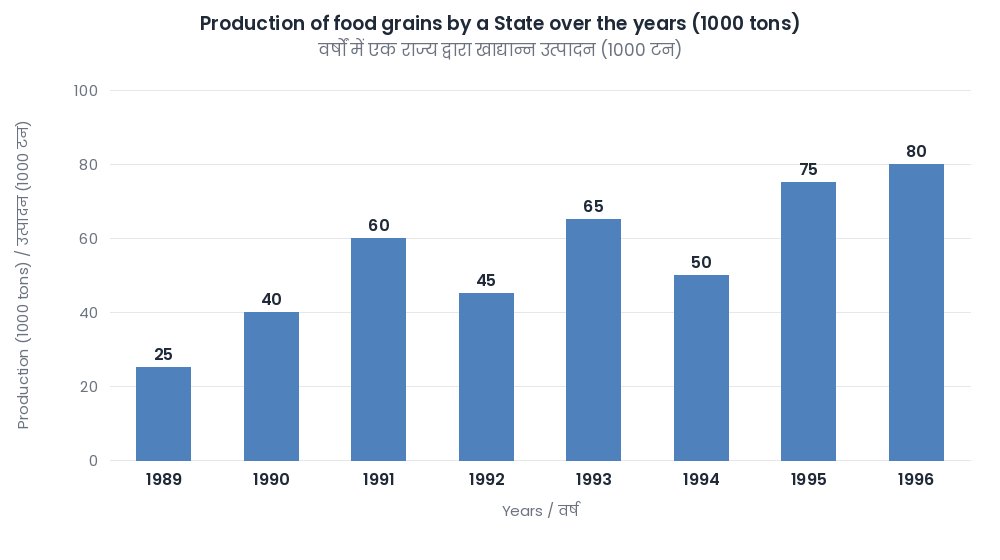
Study the given bar graph carefully and answer the following question. What was the percentage (in%) drop in the production of food grains from 1991 to 1992?
Show answer & explanationShow explanation
Answer: (D) 25
Read the graph: 1991 = 60 thousand tons, 1992 = 45 thousand tons. Percentage drop: (60 − 45)/60 × 100 = 15/60 × 100 = 25%. Correct Answer: (d) 25