SSC MTS – Multi-Tasking (Non-Technical) Staff & Havaldar Examination · Question 8
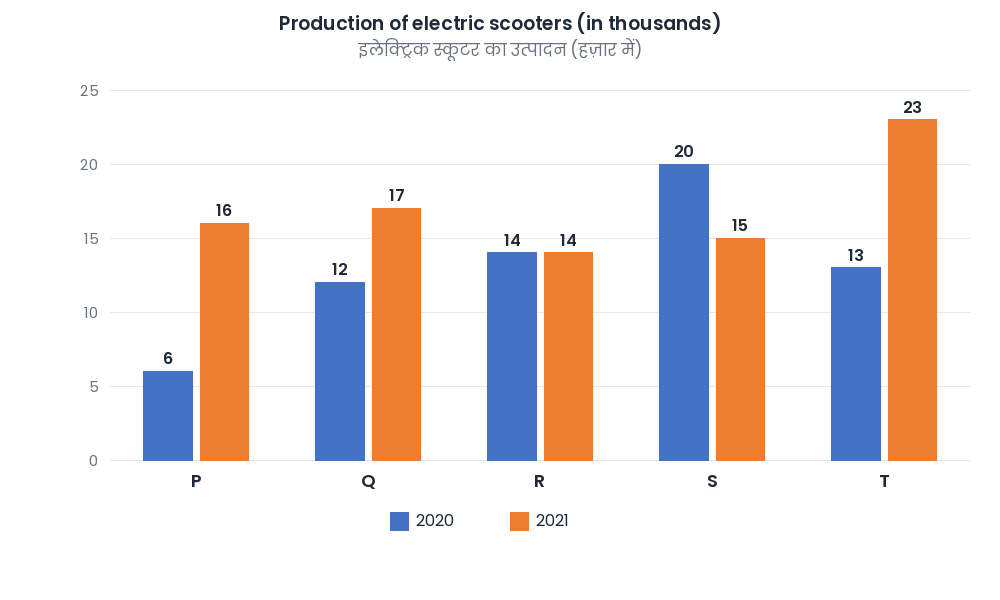
The following graph represents the production of electric scooters (in thousands) for the years 2020 and 2021 from five manufacturers P, Q, R, S, and T. The ratio of the average production by all manufacturers in 2021 to the average production by all manufacturers in 2020 is:
Show answer & explanationShow explanation
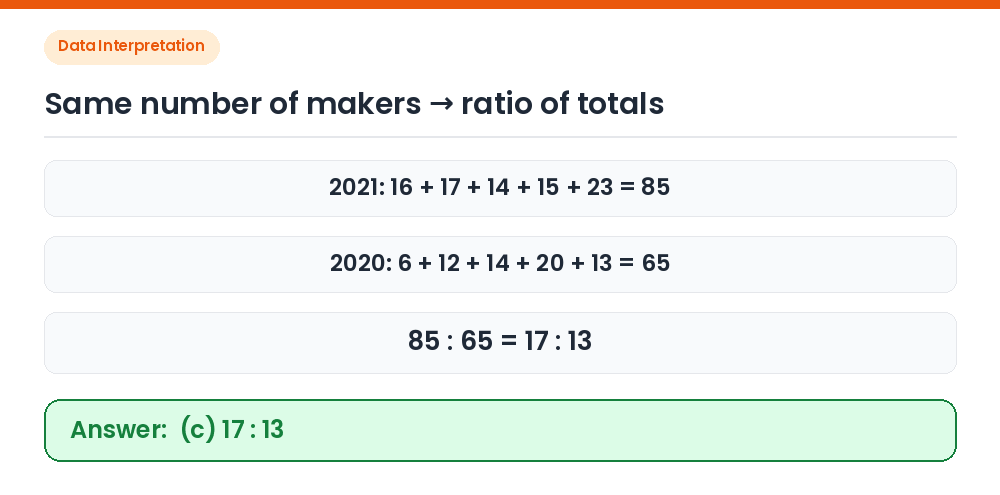
Answer: (C) 17 : 13
Totals: 2021 = 16 + 17 + 14 + 15 + 23 = 85; 2020 = 6 + 12 + 14 + 20 + 13 = 65. Ratio of averages: Both averages divide by 5, so the ratio is 85 : 65 = 17 : 13. Correct Answer: (c) 17 : 13