SSC MTS – Multi-Tasking (Non-Technical) Staff & Havaldar Examination · Question 19
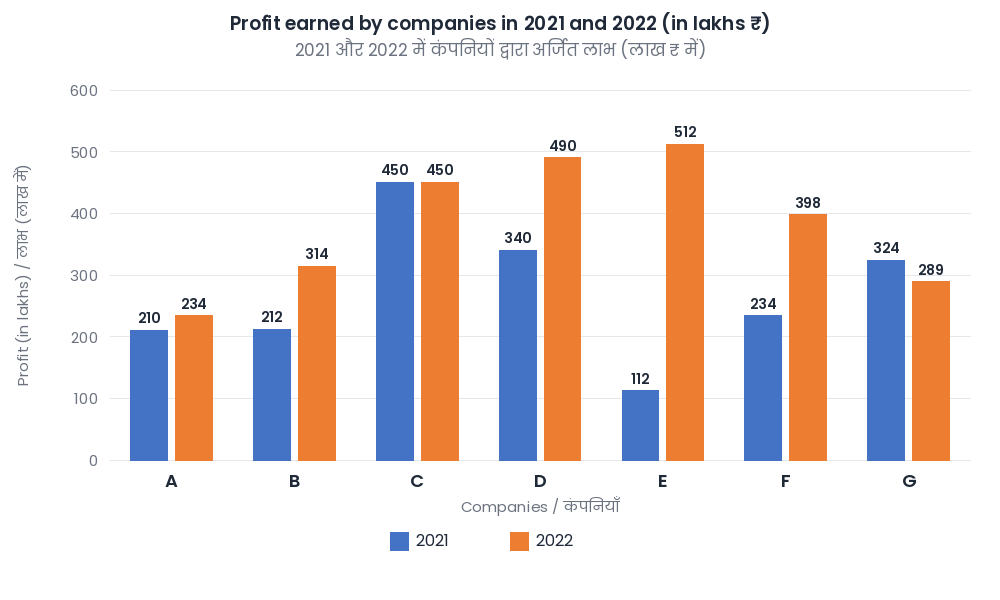
The following bar graph shows the monthly profits (in lakhs ₹) of the different companies in the year 2021 and 2022. Study the diagram and answer the following question. What is the ratio of the average profit earned by companies A, B, C and D in the year 2021 to the average profit earned by the companies C, D, E and F in the year 2022? (The question is printed as an image in the English paper; it is typed here.)
Show answer & explanationShow explanation
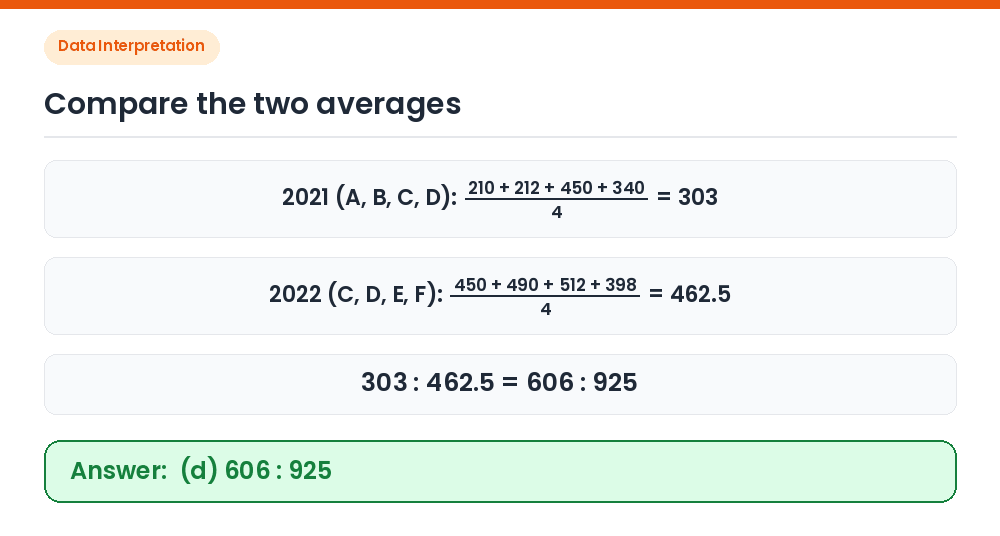
Answer: (D) 606 : 925
2021, A–D: (210 + 212 + 450 + 340)/4 = 1,212/4 = 303. 2022, C–F: (450 + 490 + 512 + 398)/4 = 1,850/4 = 462.5. Ratio: 303 : 462.5 = 606 : 925. Correct Answer: (d) 606 : 925