SSC MTS – Multi-Tasking (Non-Technical) Staff & Havaldar Examination · Question 6
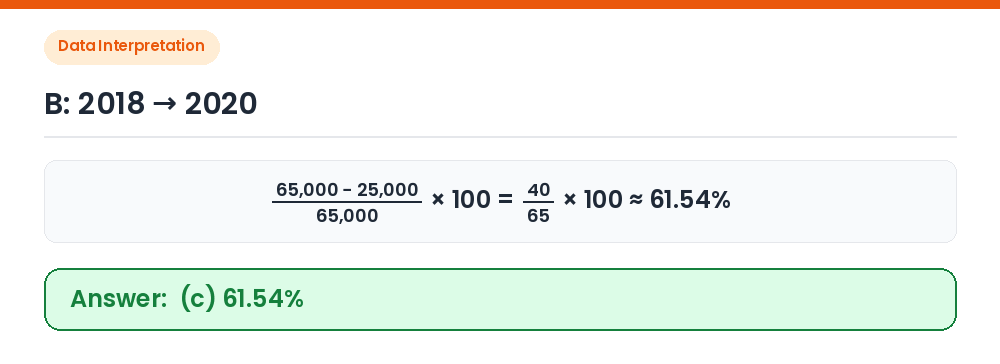
Study the given table carefully and answer the question that follows. The below table shows the production of the number of bottles (1 L) of soft drinks of three companies during 2016–2020. Year | A (in lakhs) | B (in lakhs) | C (in lakhs) 2016 | 38000 | 43000 | 52000 2017 | 42000 | 52000 | 58000 2018 | 53000 | 65000 | 63000 2019 | 30000 | 35000 | 32000 2020 | 20000 | 25000 | 28000 What was the percentage decrease in B's production in 2020 as compared to B's production in 2018 (approximate to two decimals)?
Show answer & explanationShow explanation
Answer: (C) 61.54%
B's production: 2018 = 65,000 lakh; 2020 = 25,000 lakh. Decrease %: (65,000 − 25,000)/65,000 × 100 = 40/65 × 100 ≈ 61.54%. Correct Answer: (c) 61.54%