SSC MTS – Multi-Tasking (Non-Technical) Staff & Havaldar Examination · Question 9
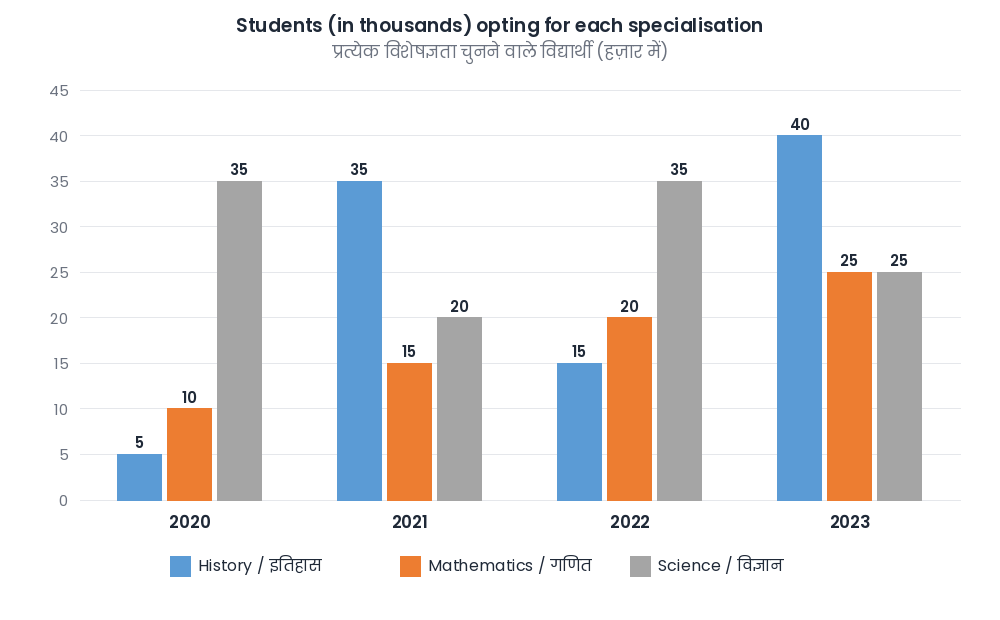
The bar graph given below represents the number of students (in thousands), who opted three different specialization during four given years in a University. The total number of students in the university in 2021 was 1,60,000; find the percentage of the students who opted for the given three subjects.
Show answer & explanationShow explanation
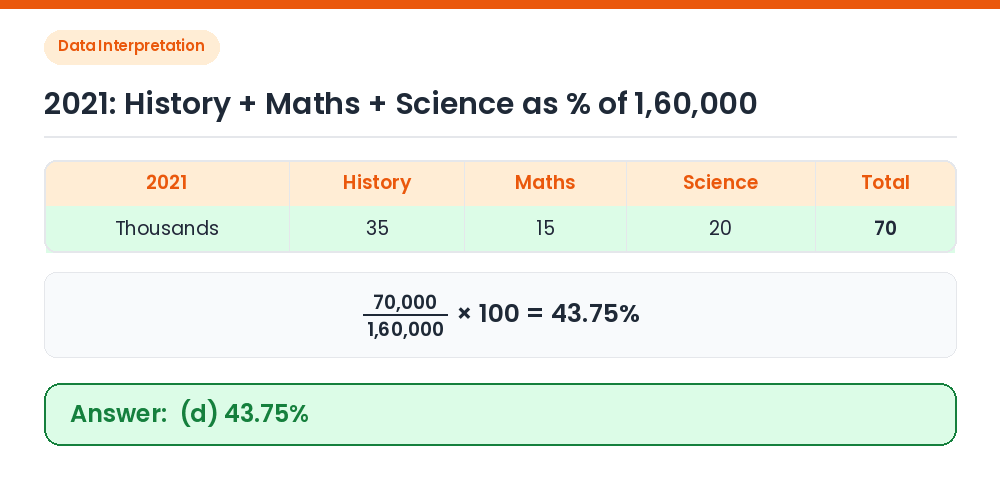
Answer: (D) 43.75%
2021 students in the three subjects: 35 + 15 + 20 = 70 thousand = 70,000. Percentage: 70,000 ÷ 1,60,000 × 100 = 43.75%. Correct Answer: (d) 43.75%