Civil Services Examination · Question 114
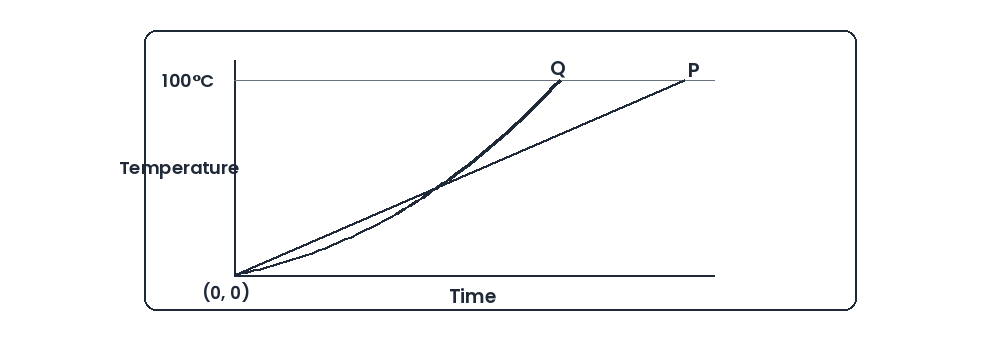
The variations in temperatures from 0°C to 100°C with respect to time of two liquids P, Q are shown in the graph given below. Which one of the following statements is correct?
Show answer & explanationShow explanation
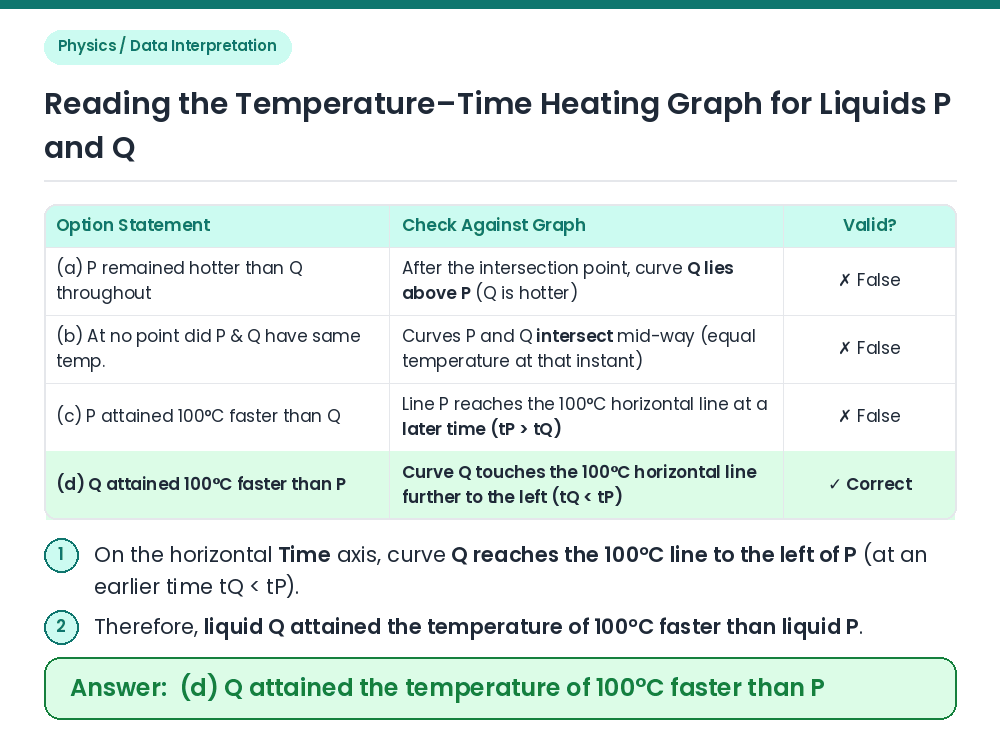
Answer: (D) Q attained the temperature of 100°C faster than P
Examine the Axes: The vertical axis represents Temperature (from 0°C to 100°C) and the horizontal axis represents Time elapsed from (0, 0). Eliminate a & b: Initially curve P is above Q, they intersect at an intermediate point (where both liquids have the exact same temperature, ruling out b), and thereafter curve Q rises above P (ruling out a). Compare Time to Reach 100°C: At the top horizontal line (100°C), curve Q reaches 100°C at an earlier time (further left on the time axis) than line P. Result: Q attained the temperature of 100°C faster than P. Correct Answer: (d) Q attained the temperature of 100°C faster than P