Civil Services Examination · Question 51
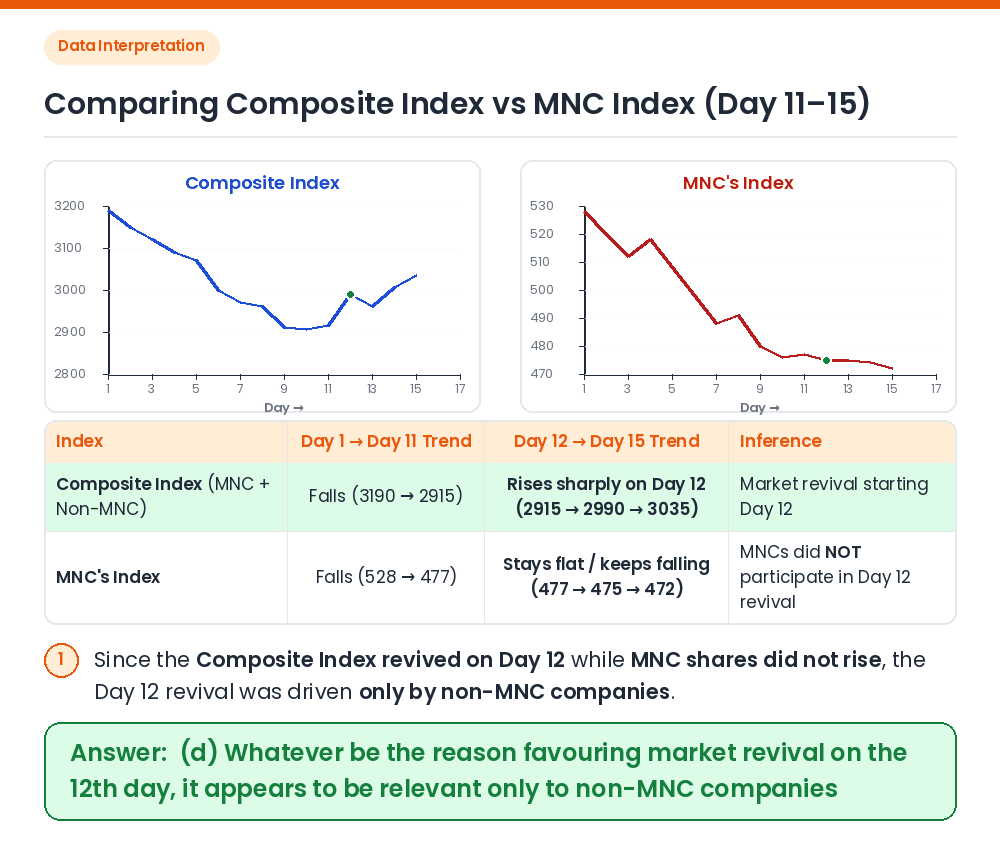
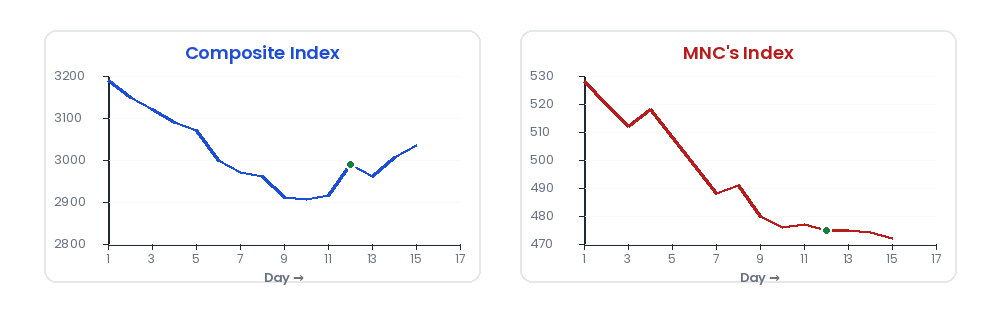
The behaviour of a fictitious stock market index (comprising a weighted average of the market prices of a selected list of companies including some multinational corporations (MNC’s)) over a 15-day period is shown in the graph. The behaviour of the MNC’s in the same period is also shown in the second graph. Which one of the following is a valid conclusion?
Show answer & explanationShow explanation
Answer: (D) Whatever be the reason favouring market revival on the 12th day, it appears to be relevant only to non-MNC companies
Given: Graph 1 shows the Composite Index (MNCs + non-MNCs) from Day 1 to Day 15; Graph 2 shows the MNC sub-index over the same period. Comparing Trends at Day 12: • Between Day 11 and Day 15, the Composite Index rebounds strongly on Day 12 (from ~2915 to ~2990 and further to ~3035). • Over the exact same period (Day 11 to Day 15), the MNC index remains flat/declining (~477 to ~472) ⇒ the Day 12 recovery came entirely from non-MNC stocks. Evaluating Other Options: (a) Percentage fall of MNCs (~10.6%) is similar to Composite (~8.6%); (b) 'every' non-MNC soaring >5% cannot be inferred from an average; (c) government policy on Day 11 is speculative. Result: Only statement (d) is a valid conclusion. Correct Answer: (d) Whatever be the reason favouring market revival on the 12th day, it appears to be relevant only to non-MNC companies