Civil Services Examination · Question 146
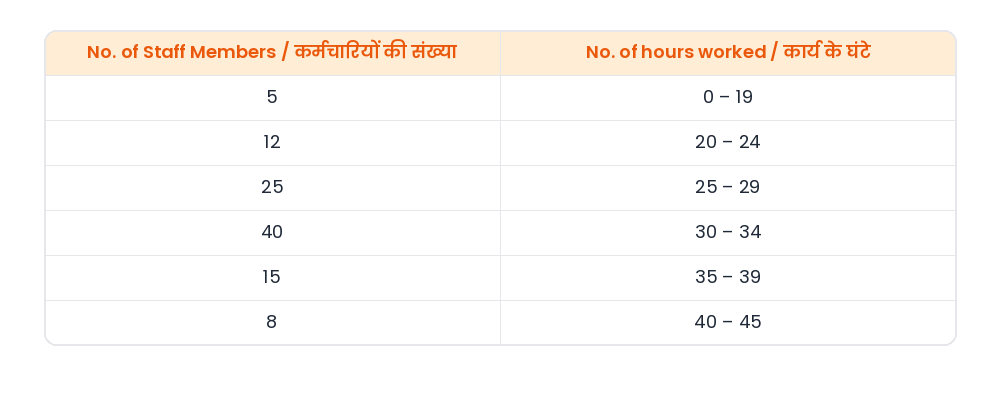
In an office, the distribution of work hours is as shown in the following table: No. of Staff Members — No. of hours worked 5 — 0 - 19 12 — 20 - 24 25 — 25 - 29 40 — 30 - 34 15 — 35 - 39 8 — 40 - 45 Consider the following inferences drawn from the table: I. The average number of hours worked by a staff member is about 30. II. The percentage of those who worked 35 or more hours is less than 25. III. At least 5 staff members worked more than 44 hours. Which of these inferences is/are valid?
Show answer & explanationShow explanation
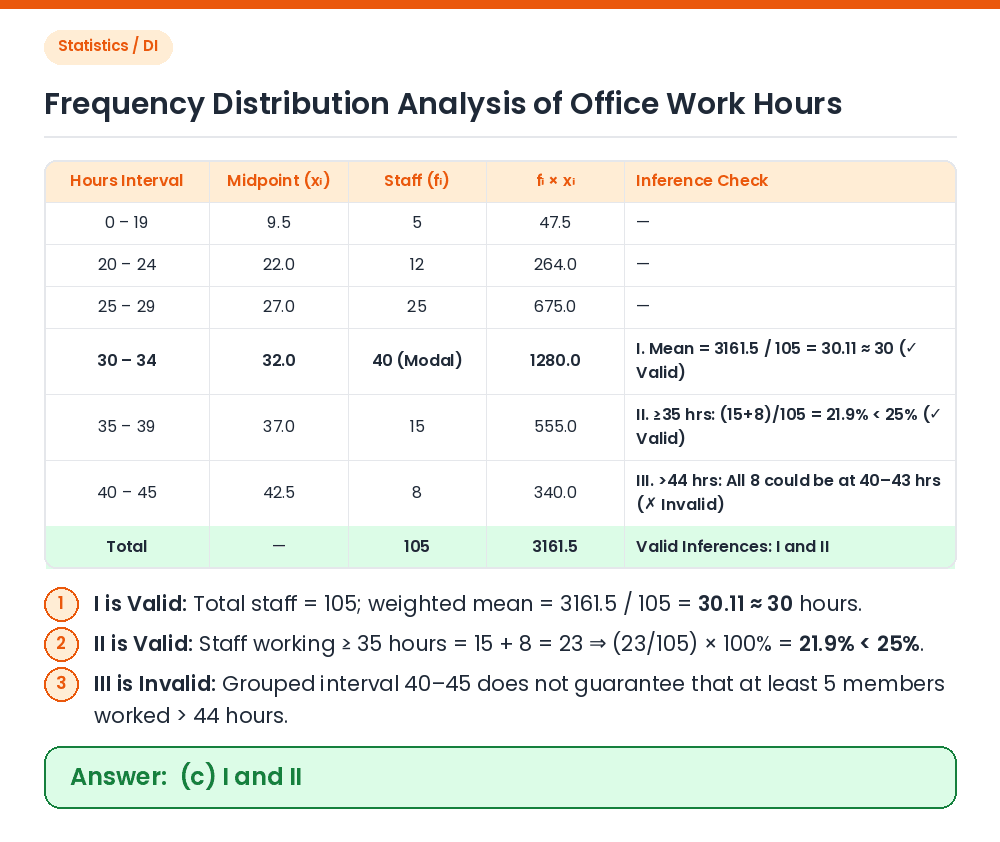
Answer: (C) I and II
Total Staff & Statement I: Sum of staff members N = 5 + 12 + 25 + 40 + 15 + 8 = 105. Using class midpoints (9.5, 22, 27, 32, 37, 42.5): ⇒ Total hours ≈ 5(9.5) + 12(22) + 25(27) + 40(32) + 15(37) + 8(42.5) = 47.5 + 264 + 675 + 1280 + 555 + 340 = 3,161.5 ⇒ Average hours = 3,161.5 ÷ 105 = 30.11 ≈ 30 ⇒ Inference I is valid. Check Statement II: Staff members working 35 or more hours = 15 (in 35–39) + 8 (in 40–45) = 23 out of 105: ⇒ Percentage = (23 / 105) × 100% = 21.90% < 25% ⇒ Inference II is valid. Check Statement III: The last class interval '40 – 45' has 8 staff members, but grouped data does not specify individual values within the interval (all 8 could have worked 40 to 43 hours) ⇒ Inference III is not necessariamente valid. Result: Inferences I and II are valid. Correct Answer: (c) I and II