Civil Services Examination · Question 146
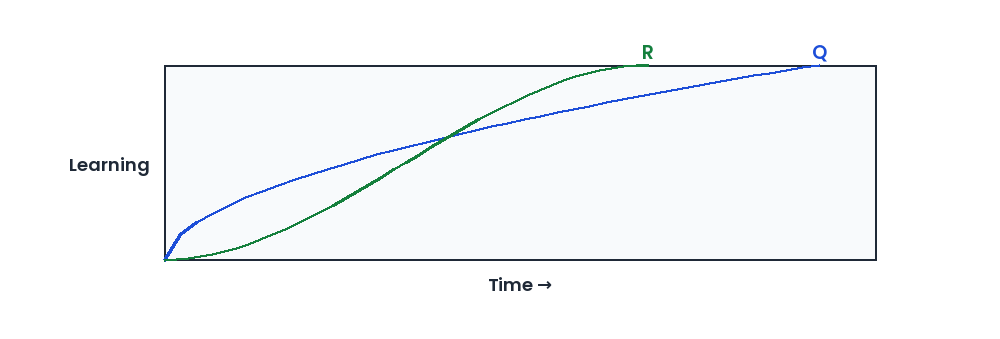
The following figure represents time vs. learning curves of two students, Q and R for learning a Mathematics lesson: Which one of the following inferences can be drawn from the graph?
Show answer & explanationShow explanation
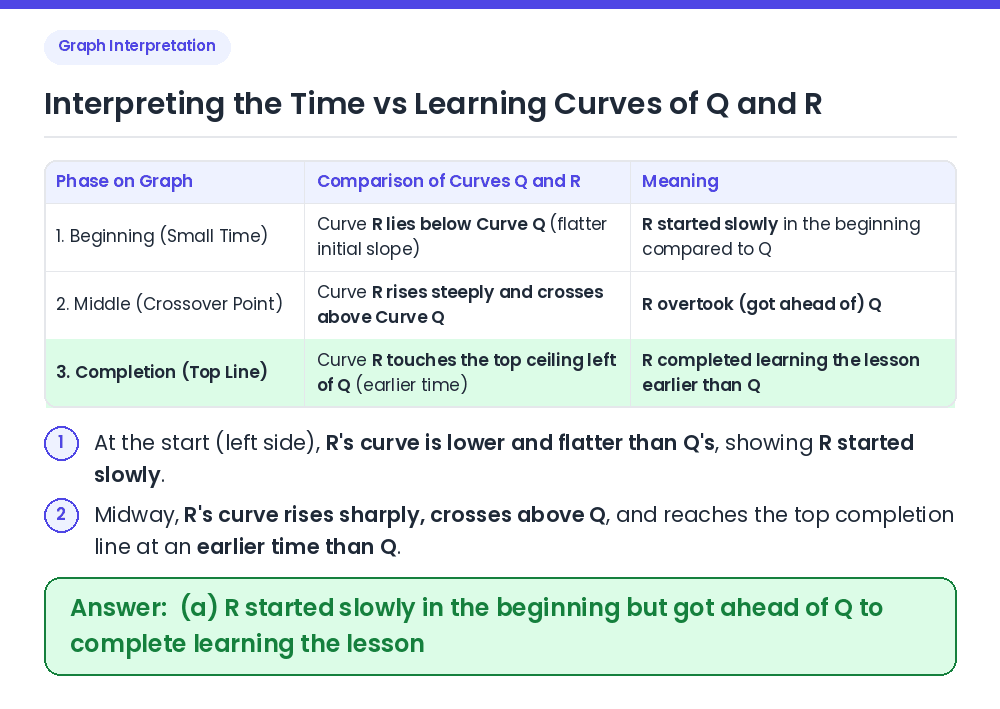
Answer: (A) R started slowly in the beginning but got ahead of Q to complete learning the lesson
Given: A graph with Time on the horizontal axis and Learning on the vertical axis, where the top horizontal line represents 100% completion of the lesson. Trace Both Curves: Near the origin (beginning), curve R lies below curve Q, meaning R started slowly ⇒ Subsequently, curve R rises steeply, intersects and passes above Q, and reaches the top horizontal completion line at a smaller value of Time (earlier) than Q. Result: R started slowly in the beginning but got ahead of Q to complete learning the lesson. Shortcut: Since the two curves cross each other, neither student was 'always faster' — eliminating (c) and (d) immediately; and R hits the top ceiling to the left of Q (earlier), confirming (a). Correct Answer: (a) R started slowly in the beginning but got ahead of Q to complete learning the lesson