Civil Services Examination · Question 53
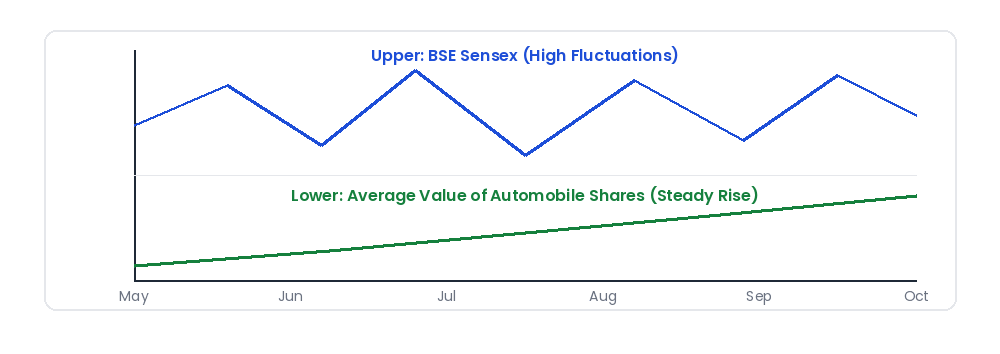
The upper part of the graph is a hypothetical movement in the BSE Sensex over a few months and the lower part is the fluctuation in the average value of automobile shares in the same period (actual values not given). Which one of the following inferences can be drawn from the graphs?
Show answer & explanationShow explanation
Answer: (C) Automobile shares have shown a steady improvement in price, unaffected by large fluctuations in BSE Sensex
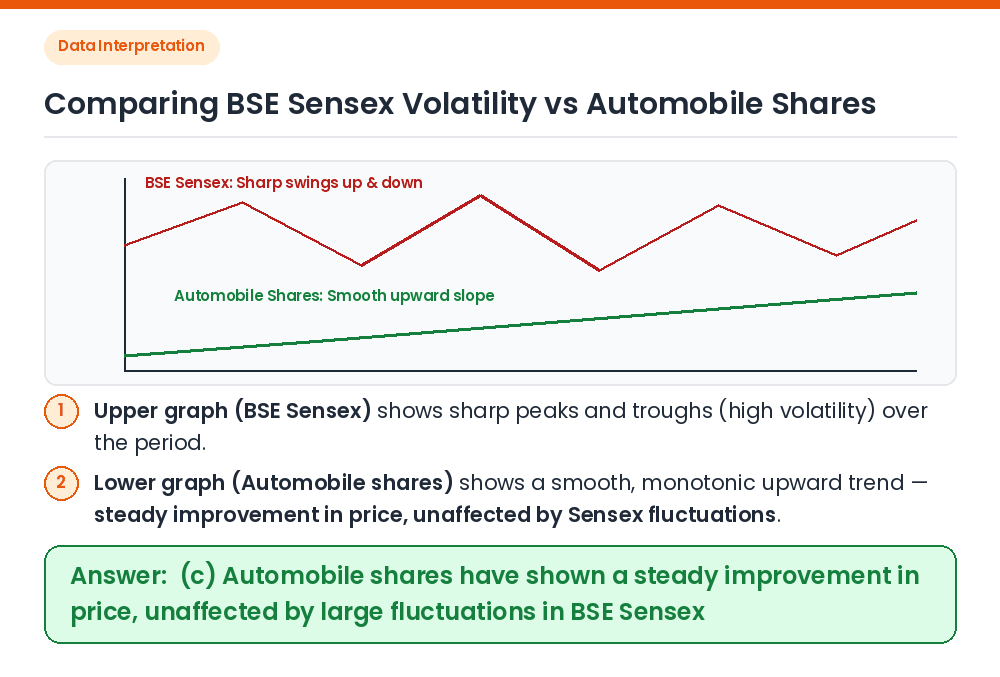
Given: The upper curve plots the overall BSE Sensex movement over several months, while the lower curve plots the average price of automobile shares over the exact same period. Compare Trends: While the upper BSE Sensex curve exhibits wide oscillations (steep rises and falls), the lower automobile-share curve rises steadily with minimal volatility. Result: We can infer that automobile shares have shown a steady improvement in price, unaffected by large fluctuations in the BSE Sensex. Shortcut: Eliminate (b) immediately as political causes are not shown in price-time graphs, and eliminate (a) since the lower curve is smooth while the upper curve is jagged. Correct Answer: (c) Automobile shares have shown a steady improvement in price, unaffected by large fluctuations in BSE Sensex