Civil Services Examination · Question 36
Directions for the following 4 (four) items : The following graph shows the average profit of two fruit-sellers A and B in thousands (₹) per year from the year 1995 to 2000. Consider the graph and answer the 4 (four) items that follow :
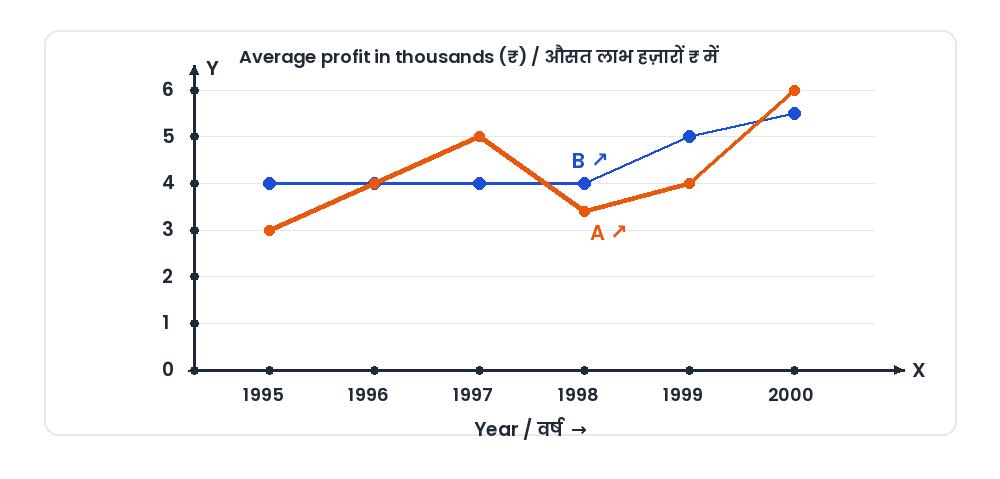
How much more average profit did A make in the year 2000 than in the year 1999?
Show answer & explanationShow explanation
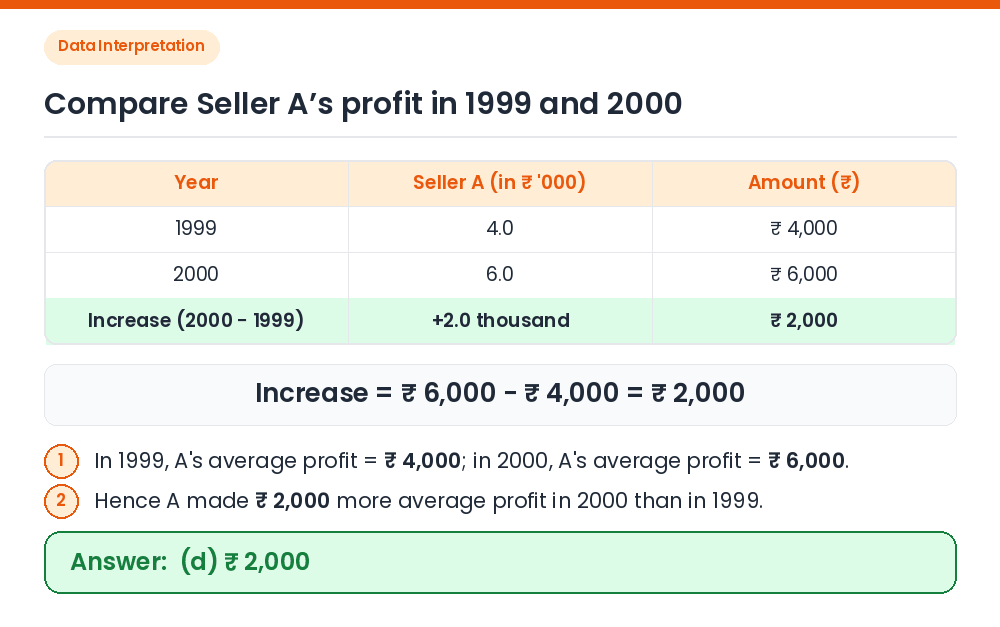
Answer: (D) ₹ 2,000
Given / Concept: Read the average profit of fruit-seller A in the years 1999 and 2000 from the graph. Calculate difference: ⇒ Average profit of A in 1999 = 4 thousand = ₹ 4,000. ⇒ Average profit of A in 2000 = 6 thousand = ₹ 6,000. ⇒ Extra profit in 2000 = ₹ 6,000 − ₹ 4,000 = ₹ 2,000. Result: A made ₹ 2,000 more average profit in 2000 than in 1999. Correct Answer: (d) ₹ 2,000