UP Super TET · Question 73
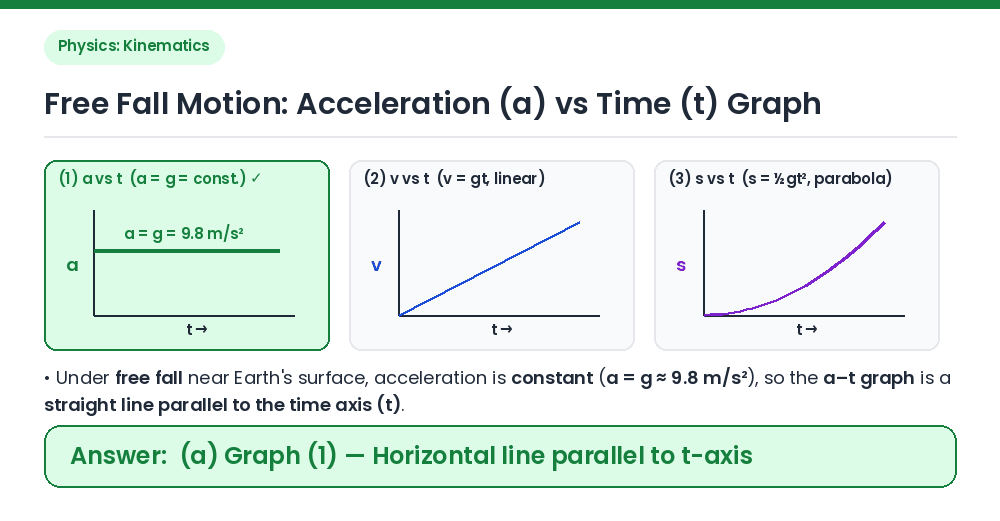
Which one of the following graph represents acceleration (a) vs Time (t) of an object moving under free fall?
Show answer & explanationShow explanation
Answer: (A) Graph (1): Horizontal straight line parallel to time axis t
Graph (1) — a horizontal straight line parallel to the time axis (t) — correctly represents the acceleration (a) vs time (t) graph of an object moving under free fall. During free fall near the Earth's surface (neglecting air resistance), an object experiences a constant downward acceleration equal to acceleration due to gravity (a = g ≈ 9.8 m/s²), which remains independent of time t. Why other options are wrong: • (b) Graph (2) (Straight line through origin): Represents the velocity-time (v vs t) graph of free fall starting from rest (v = gt). • (c) Graph (3) (Parabola through origin): Represents the displacement-time (s vs t) graph of free fall (s = ½gt²). • (d) Graph (4) (Line with negative slope): Represents uniformly decreasing acceleration, which does not occur in free fall. Related Facts: • The slope of a velocity-time (v–t) graph gives acceleration (a = dv/dt = g), and the area under an acceleration-time (a–t) graph gives the change in velocity (Δv = g·t). Correct Answer: (a) Graph (1): Horizontal straight line parallel to time axis t