
RRB NTPC · Question 12
The following graph shows the production (in tones) of a product from 1980 to 1985. Answer the given question based on the graph
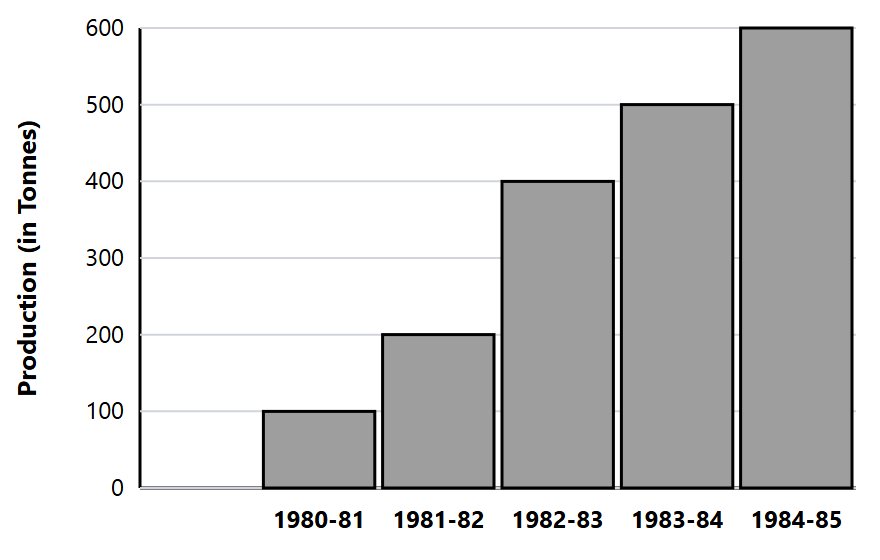
In which year was the absolute increase in production tonnage the highest as compared to the previous year?
Show answer & explanation
Answer: (D) 1982 - 83
Explanation
Production rose 100 → 200 (+100), 200 → 400 (+200), 400 → 500 (+100) and 500 → 600 (+100). The largest absolute increase, 200 tonnes, was in 1982–83.