
RRB NTPC · Question 11
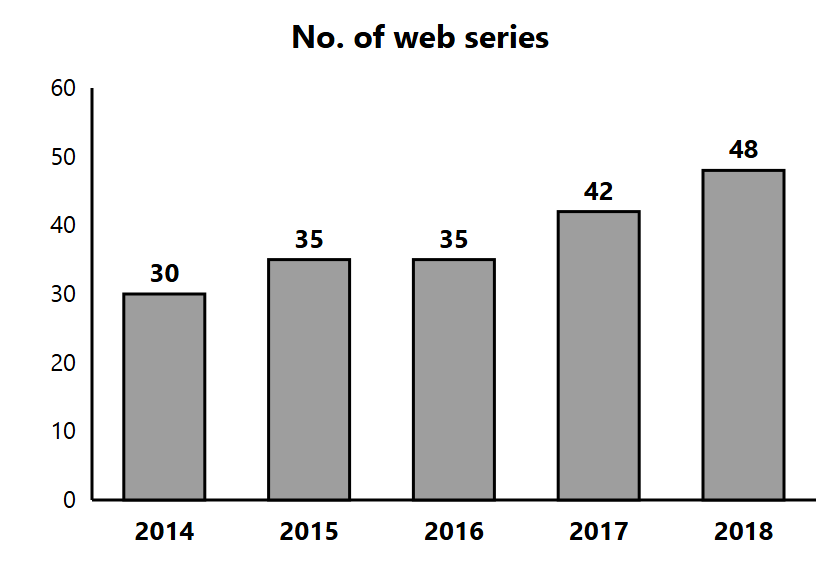
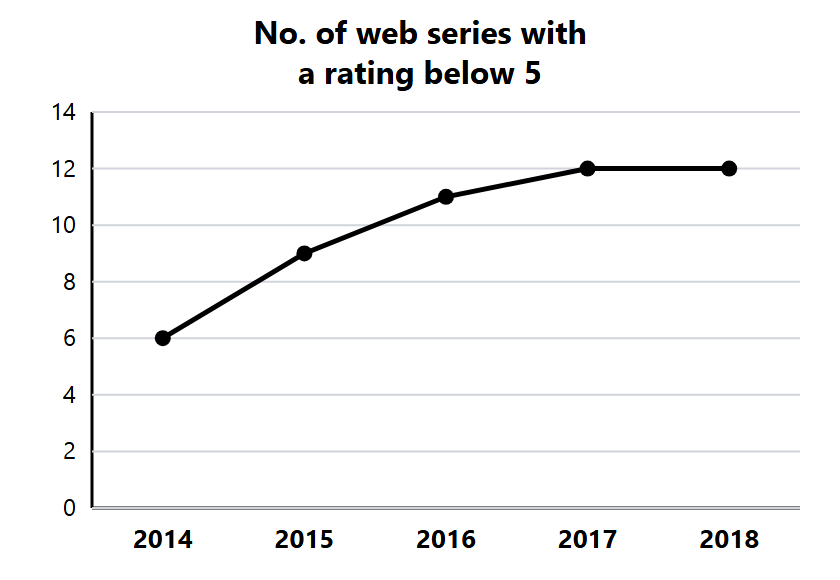
The following bar graph shows the number of web series released by a subscription service mobile application in various years from 2014-2018 and the line graph shows the number of web series with a rating of less than 5 stars. Find the approximate total percentage of web series with a rating 5 star and above from 2014 to 2018.
Show answer & explanation
Answer: (A) 74
Explanation
Total released = 30 + 35 + 35 + 42 + 48 = 190; rated below 5 = 6 + 9 + 11 + 12 + 12 = 50. Rated 5 and above = 140, and 140/190 ≈ 73.7%, about 74%.