
RRB NTPC · Question 54
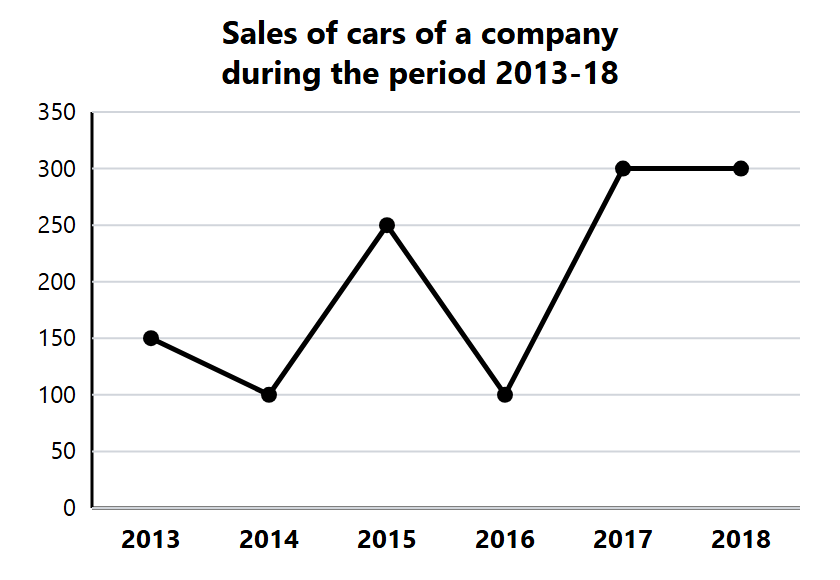
From the given diagram, determine the difference between the total number of cars sold in the first three years and in the last three years.
Show answer & explanation
Answer: (C) 200
Explanation
First three years: 150 + 100 + 250 = 500. Last three: 100 + 300 + 300 = 700. Difference = 200.