SSC CGL – Combined Graduate Level Examination · Question 64
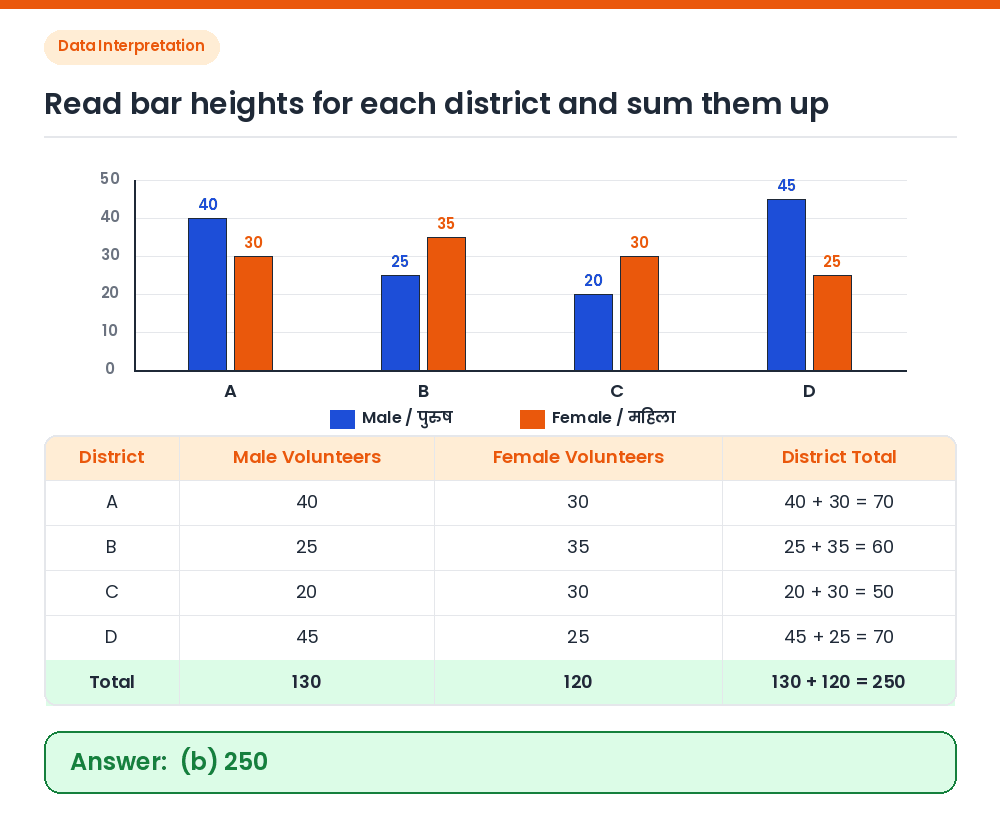
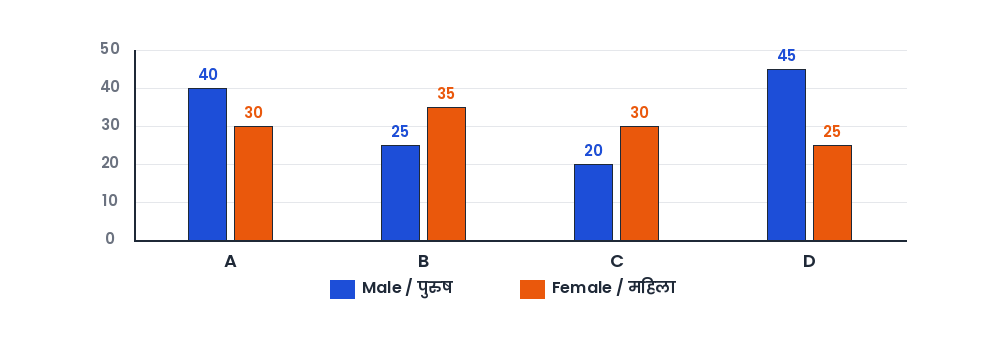
Study the given graph carefully and answer the question that follows. The given graph shows the number of male and female volunteers for helping handicapped people from four different districts A, B, C and D. Find the number of volunteers altogether.
Show answer & explanationShow explanation
Answer: (B) 250
Read the bar values for each district: • District A: Male = 40, Female = 30 → Total = 70 • District B: Male = 25, Female = 35 → Total = 60 • District C: Male = 20, Female = 30 → Total = 50 • District D: Male = 45, Female = 25 → Total = 70 Add all volunteers: Total = 70 + 60 + 50 + 70 = 250. Correct Answer: (b) 250