SSC CGL – Combined Graduate Level Examination · Question 66
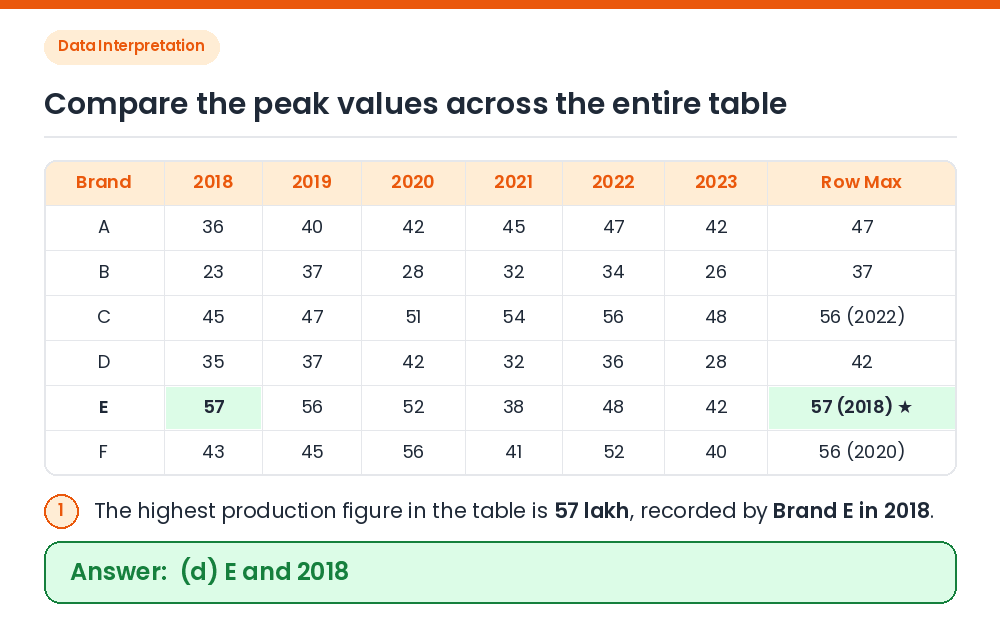
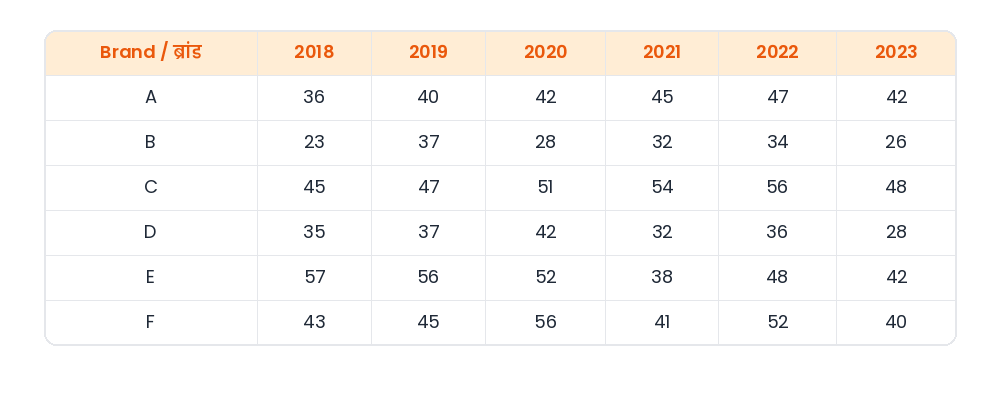
Study the given table and answer the question. The table displays the number of cars produced (in lakhs) by six different brands between 2018 and 2023. Brand | 2018 | 2019 | 2020 | 2021 | 2022 | 2023 A | 36 | 40 | 42 | 45 | 47 | 42 B | 23 | 37 | 28 | 32 | 34 | 26 C | 45 | 47 | 51 | 54 | 56 | 48 D | 35 | 37 | 42 | 32 | 36 | 28 E | 57 | 56 | 52 | 38 | 48 | 42 F | 43 | 45 | 56 | 41 | 52 | 40 Which brand production is the highest, and in which year?
Show answer & explanationShow explanation
Answer: (D) E and 2018
Compare the four options from the table: • Brand C in 2022 = 56 • Brand E in 2019 = 56 • Brand F in 2020 = 56 • Brand E in 2018 = 57 Identify the maximum: 57 (Brand E in 2018) is the highest value in the entire table. Correct Answer: (d) E and 2018