Civil Services Examination · Question 21
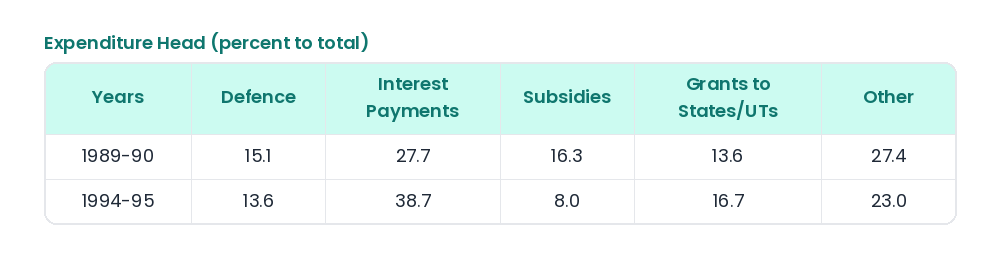
The following Table shows the percentage distribution of revenue expenditure of Government of India in 1989-90 and 1994-95: Years | Defence | Interest Payments | Subsidies | Grants to States/UTs | Other 1989-90 | 15.1 | 27.7 | 16.3 | 13.6 | 27.4 1994-95 | 13.6 | 38.7 | 8.0 | 16.7 | 23.0 Based on this table, it can be said that the Indian economy is in poor shape because the Central Government continues to be under pressure to
Show answer & explanationShow explanation
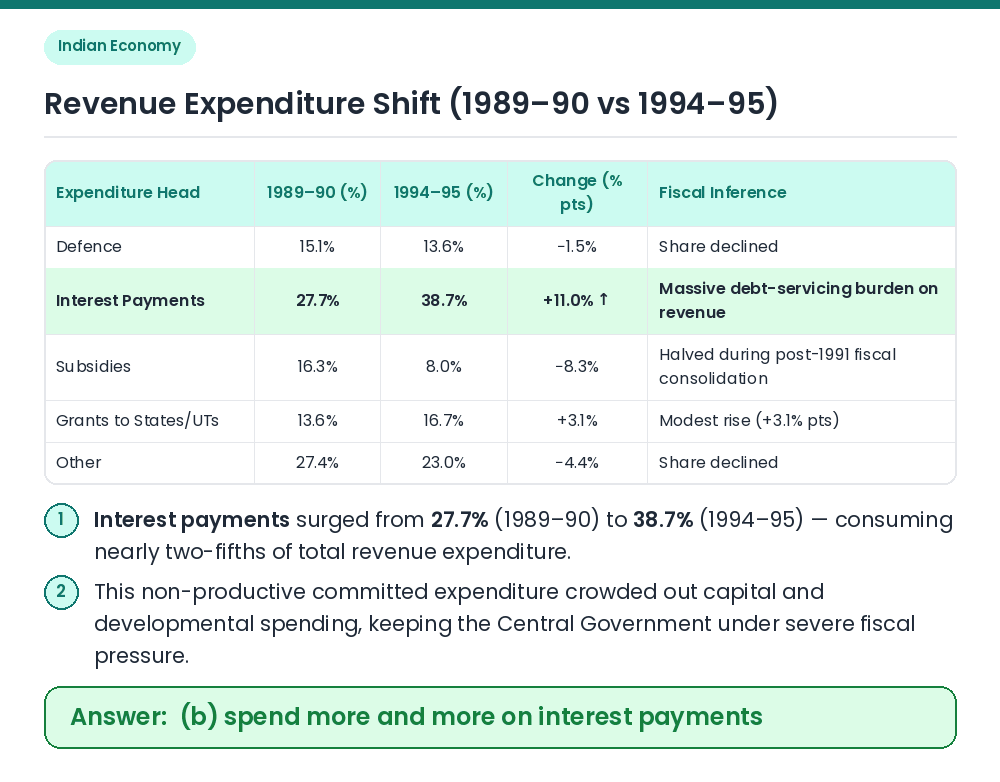
Answer: (B) spend more and more on interest payments
Given: Compare the percentage shares of the five revenue expenditure heads between 1989–90 and 1994–95. Analyze Changes: ⇒ Interest payments jumped by 11.0 percentage points from 27.7% in 1989–90 to 38.7% in 1994–95, making it by far the single largest component of Central Government revenue expenditure. Fiscal Implication: ⇒ High and rising interest payments reflect accumulated public debt; because interest is a committed, non-developmental revenue expenditure, it crowds out productive public investment. Result: The Central Government continues to be under pressure to spend more and more on interest payments. Related Facts: • Primary Deficit: Fiscal Deficit minus Interest Payments equals Primary Deficit, which measures current borrowing net of past debt-servicing obligations. Correct Answer: (b) spend more and more on interest payments