Civil Services Examination · Question 15
Directions for the following item: The following pie charts show the break up of disease categories recorded in the patients from two towns, Town A and Town B. Pie charts plot the disease categories as percentage of the total number of patients. Based on these, answer the item that follows the charts.
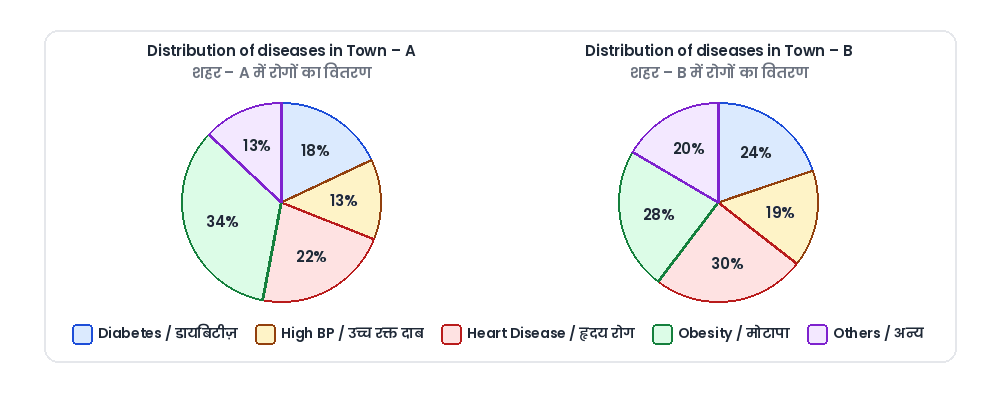
Town A: Diabetes 18%, High BP 13%, Heart Disease 22%, Obesity 34%, Others 13% Town B: Diabetes 24%, High BP 19%, Heart Disease 30%, Obesity 28%, Others 20% What can we say about persons with more than one disease from these graphs?
Show answer & explanationShow explanation
Answer: (B) There are likely to be persons with more than one disease in Town B.
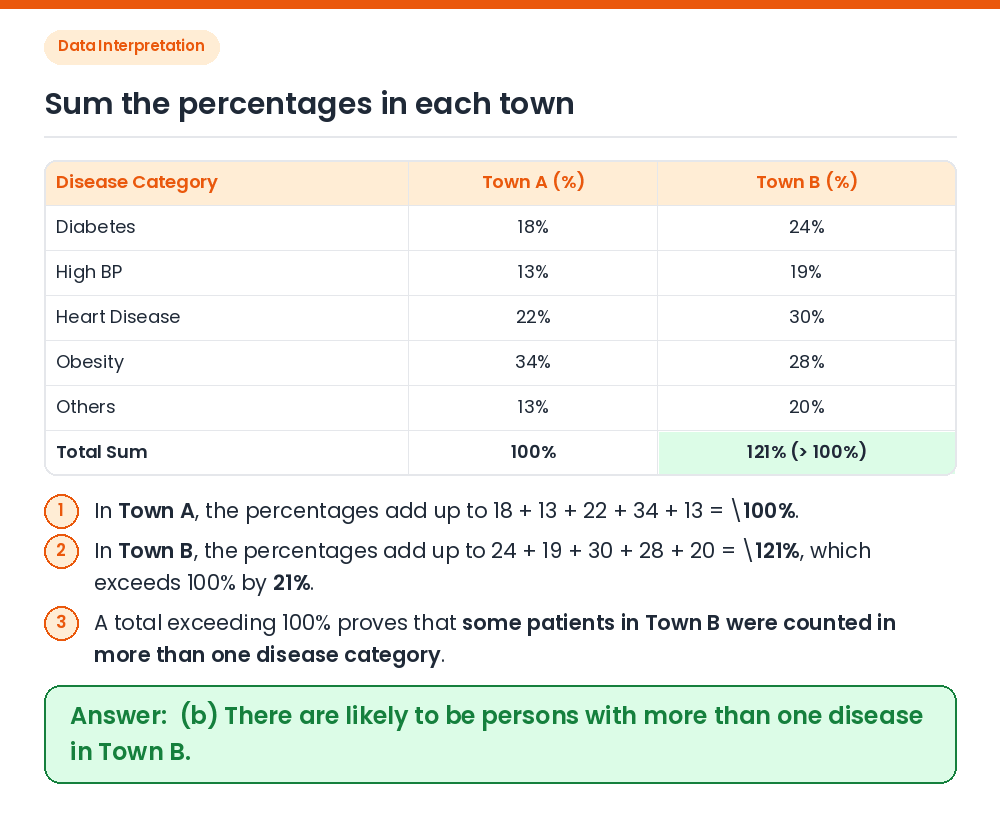
Given / Concept: If disease categories are mutually exclusive, their percentages of total patients must sum to 100%; a sum above 100% indicates overlapping categories (patients having multiple diseases). Sum for Town A: 18% + 13% + 22% + 34% + 13% = 100%. Sum for Town B: 24% + 19% + 30% + 28% + 20% = 121% > 100% ⇒ at least 21% of patients are counted in more than one disease category. Result: There are likely to be persons with more than one disease in Town B. Correct Answer: (b) There are likely to be persons with more than one disease in Town B.