Civil Services Examination · Question 47
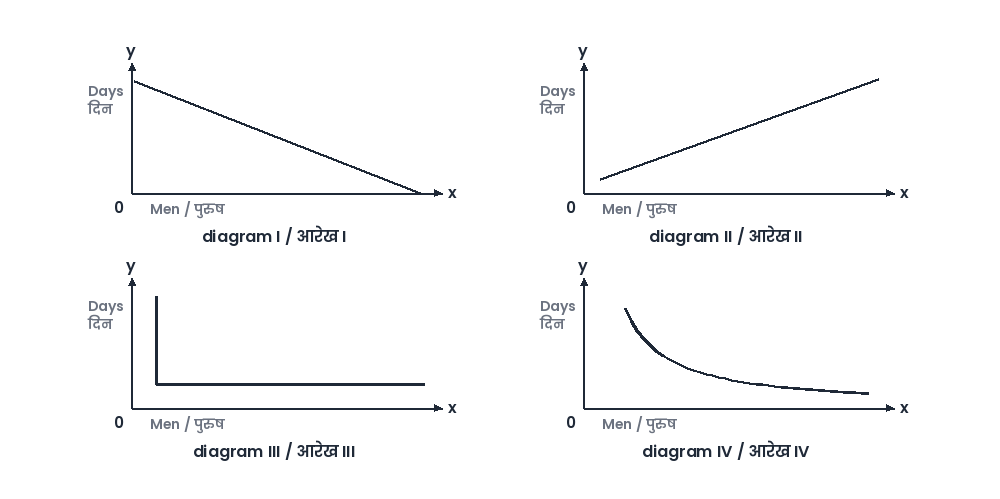
Consider the following diagrams : x men, working at constant speed, do a certain job in y days. Which one of these diagrams shows the relation between x and y ?
Show answer & explanationShow explanation
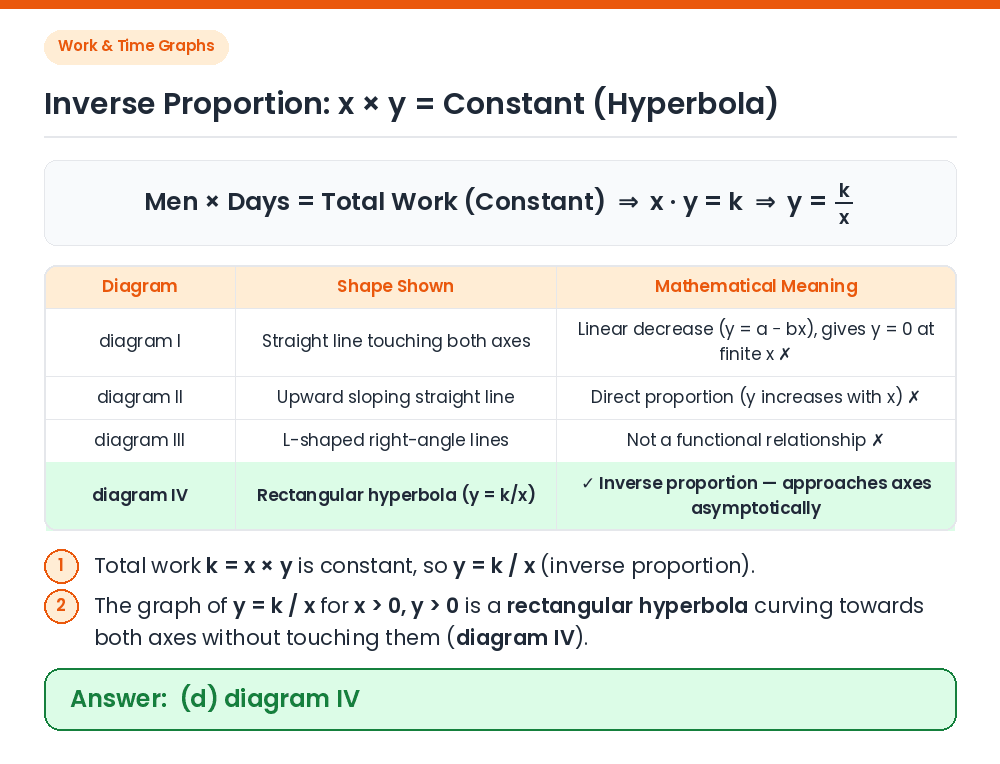
Answer: (D) diagram IV
Given: x men working at a constant speed finish a certain job in y days. Form equation: Total man-days required for the job is constant ⇒ x × y = k ⇒ y = k / x (where k > 0). Identify graph: Since x and y are inversely proportional, as x increases, y decreases along a smooth rectangular hyperbola that never touches either axis (since neither x nor y can be 0). Result: Diagram IV correctly shows the inverse proportion relation between x and y. Correct Answer: (d) diagram IV