Civil Services Examination · Question 52
Directions for the item: Study the two figures given below and answer the item that follows : Figure 1 (Bar Chart — Number of Professors in selected disciplines in a University by sex): • Physics: Male = 32, Female = 8 (Total = 40) • Mathematics: Male = 28, Female = 8 (Total = 36) • Chemistry: Male = 16, Female = 22 (Total = 38) • Botany: Male = 10, Female = 14 (Total = 24) • Psychology: Male = 4, Female = 6 (Total = 10) • Economics: Male = 24, Female = 8 (Total = 32)
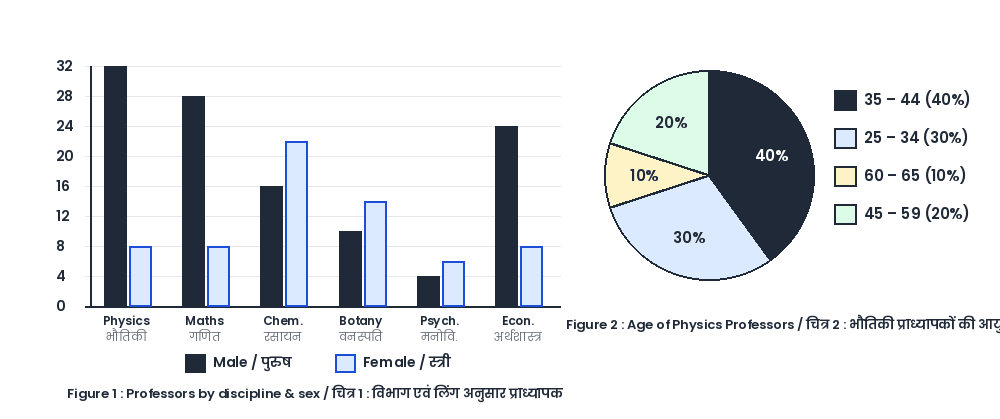
Figure 2 (Pie Chart — Age of Physics Professors): • 35 – 44 years: 40% • 25 – 34 years: 30% • 45 – 59 years: 20% • 60 – 65 years: 10% How many Physics professors belong to the age group 35 – 44 ?
Show answer & explanationShow explanation
Answer: (B) 16
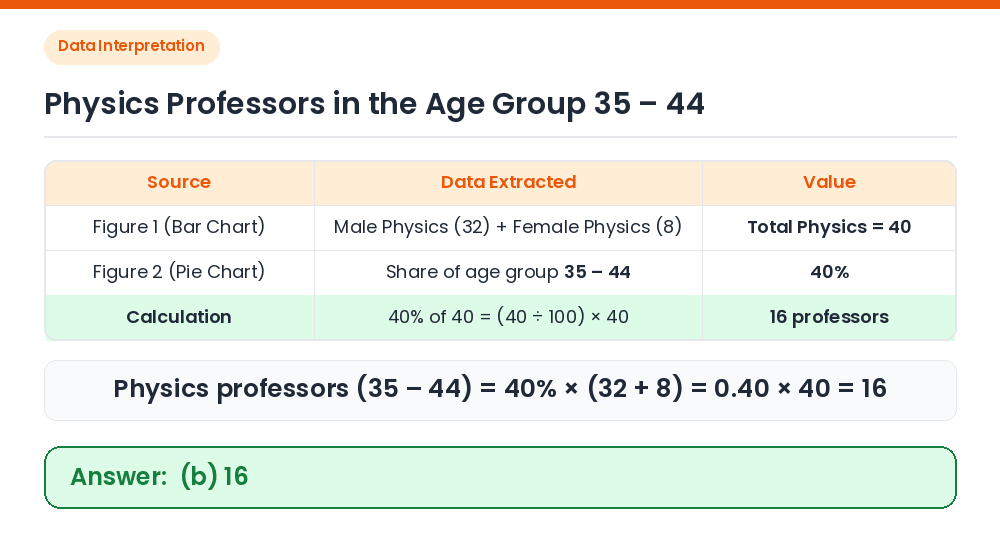
Given: From Figure 1, Physics professors = 32 (Male) + 8 (Female) = 40; from Figure 2, age group 35–44 = 40%. Calculate count: Number of Physics professors in age group 35–44 = 40% of 40 ⇒ (40 / 100) × 40 = 16. Result: 16 Physics professors belong to the age group 35 – 44. Correct Answer: (b) 16