Civil Services Examination · Question 52
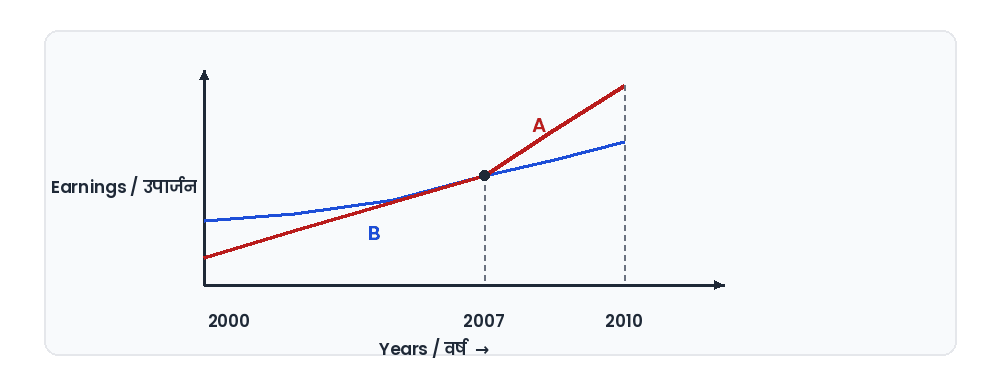
The graph below depicts the earnings of A and B over the period 2000 to 2010: From the graph, which one of the following can be concluded?
Show answer & explanationShow explanation
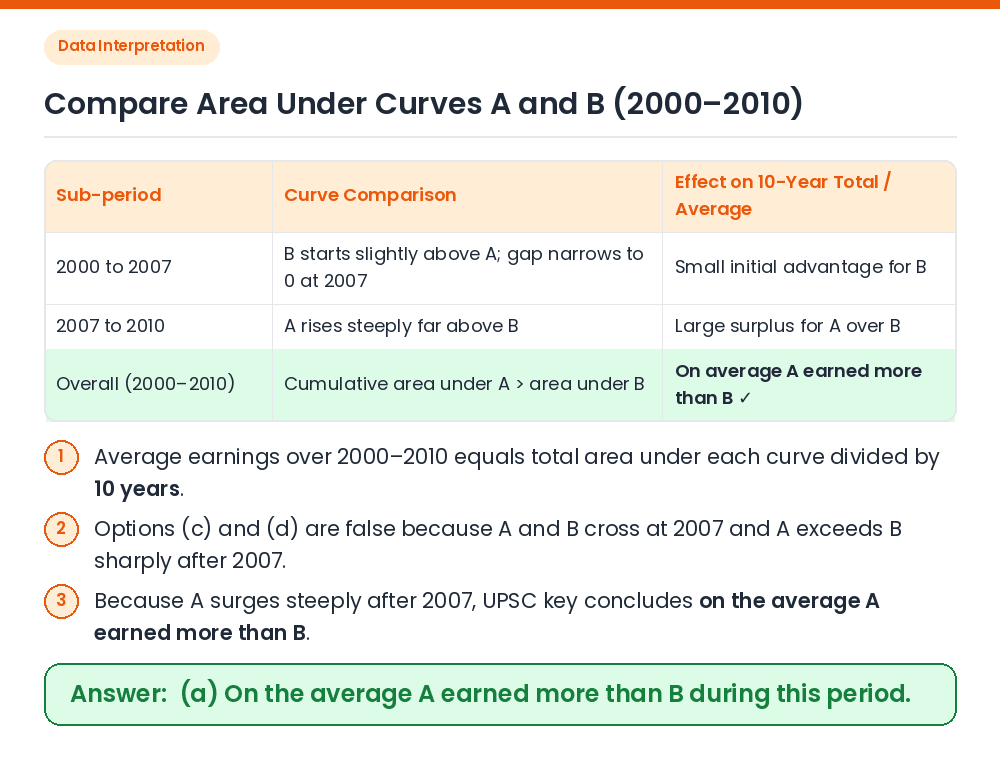
Answer: (A) On the average A earned more than B during this period.
Given / Concept: A line/curve graph showing the earnings of A and B from 2000 to 2010, intersecting in the year 2007. Eliminate Absolute Statements: Before 2007, B's curve is above A's, while from 2007 to 2010, A's curve is above B's. Hence, neither was always equal (c) nor was A always less than B (d). Compare Cumulative Area / Average: From 2000 to 2007, B starts only slightly above A and the narrow gap closes rapidly, whereas after 2007, A rises very steeply to a much higher level than B by 2010. Result: Taking the sharp upward surge of A as outweighing the small initial deficit (though no numerical y-axis scale is printed), the official UPSC key concludes that on average A earned more than B. Correct Answer: (a) On the average A earned more than B during this period.