Civil Services Examination · Question 5
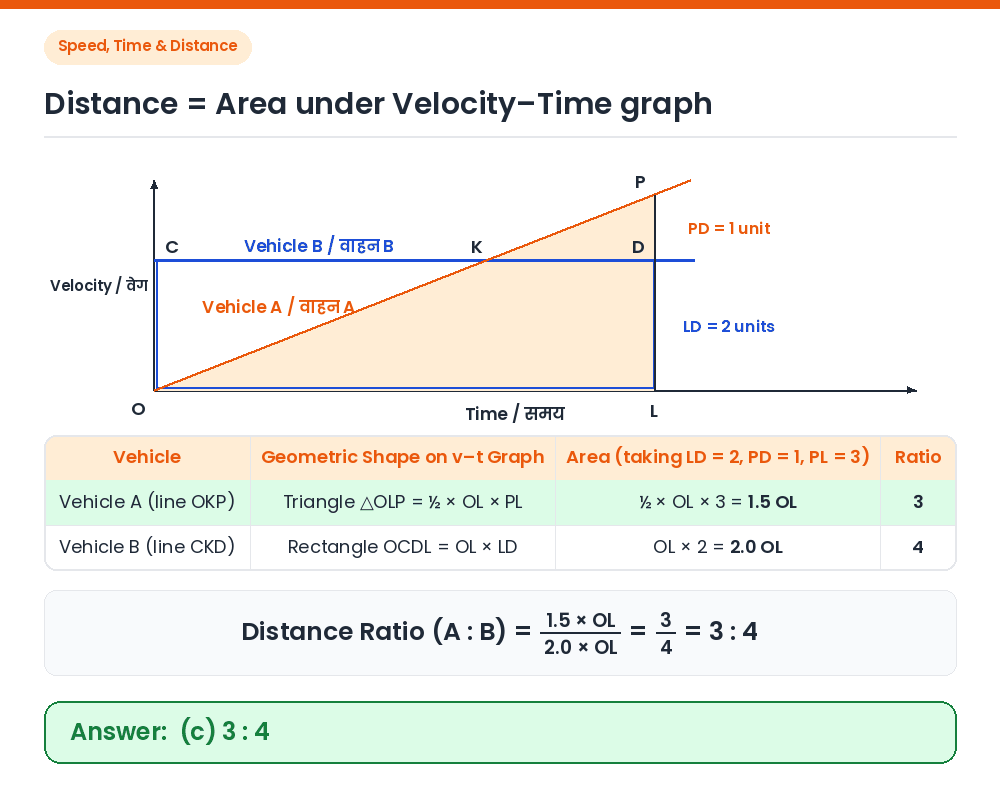
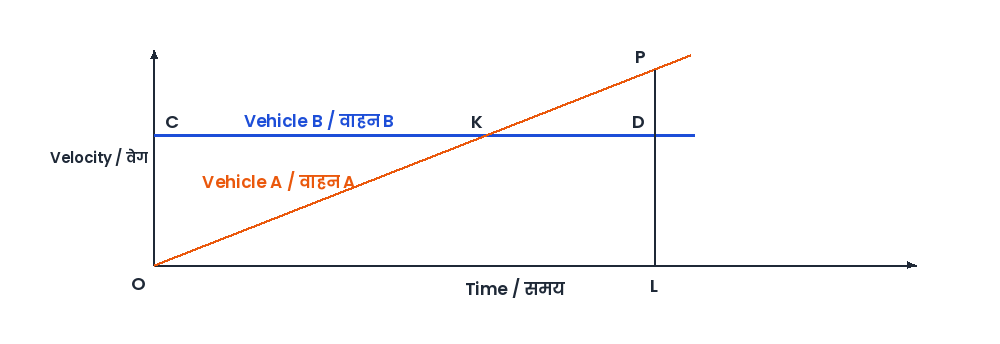
The figure drawn below gives the velocity graphs of two vehicles A and B. The straight line OKP represents the velocity of vehicle A at any instant, whereas the horizontal straight line CKD represents the velocity of vehicle B at any instant. In the figure, D is the point where perpendicular from P meets the horizontal line CKD such that PD = (1/2) LD : What is the ratio between the distances covered by vehicles A and B in the time interval OL?
Show answer & explanationShow explanation
Answer: (C) 3 : 4
Given: Velocity–time graphs of vehicle A (line OKP) and vehicle B (horizontal line CKD) over time interval OL, with PD = (1/2) LD. Heights in terms of LD: Since D lies between P and L on the perpendicular PL, total height PL = PD + LD = (1/2) LD + LD = (3/2) LD. Distance of A: Distance = Area under v–t graph = Area of △OLP = (1/2) × OL × PL = (1/2) × OL × (3/2) LD = (3/4) × OL × LD. Distance of B: Distance = Area of rectangle OCDL = OL × LD. Ratio A : B: [(3/4) × OL × LD] : [OL × LD] = 3 : 4. Shortcut: Take LD = 2 units ⇒ PD = 1 unit and PL = 3 units. Average velocity of A = 3/2 = 1.5, constant velocity of B = 2 ⇒ ratio = 1.5 : 2 = 3 : 4. Correct Answer: (c) 3 : 4