Civil Services Examination · Question 61
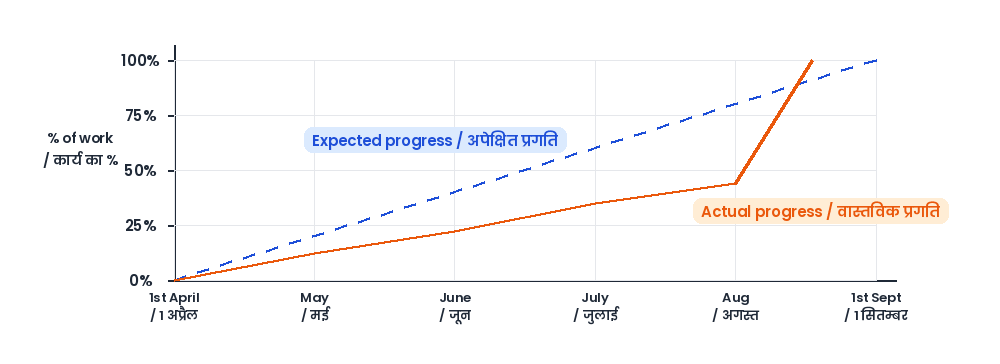
Consider the following graph : Which one of the following statements is not correct with reference to the graph given above?
Show answer & explanationShow explanation
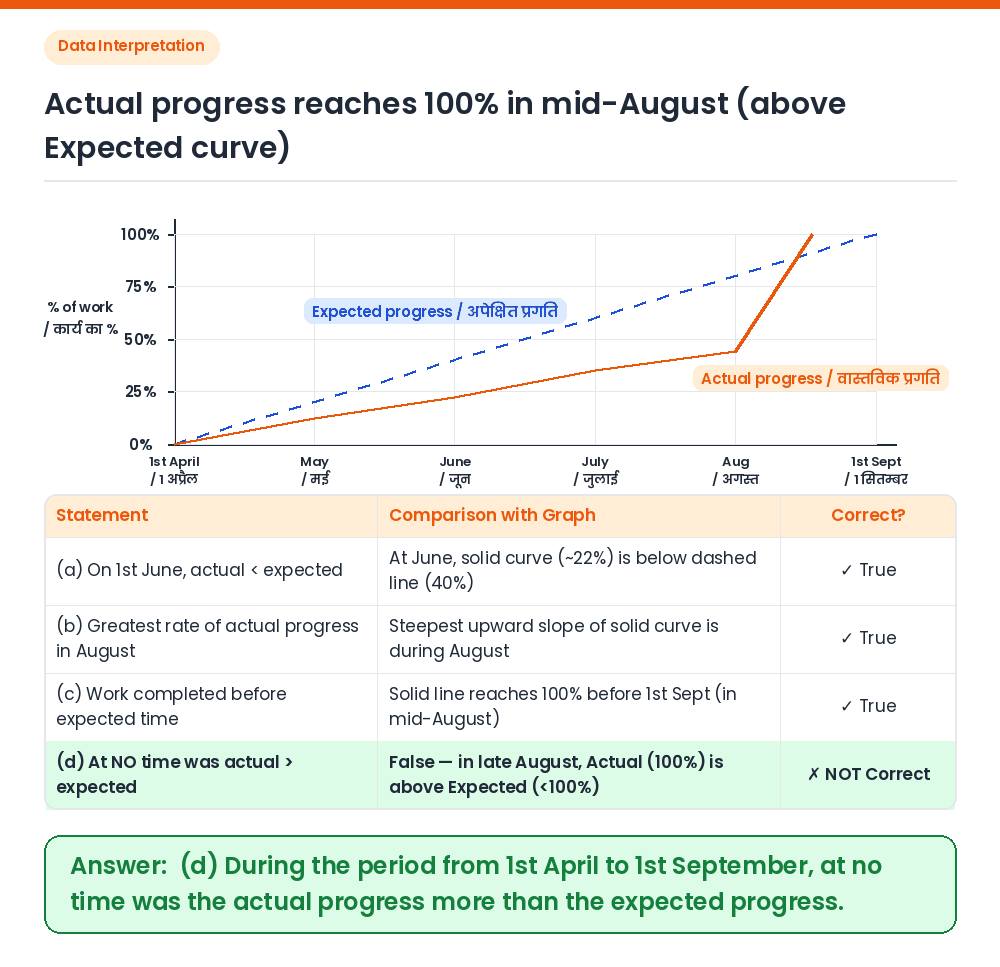
Answer: (D) During the period from 1st April to 1st September, at no time was the actual progress more than the expected progress.
Given: A progress graph showing Expected progress (dashed straight line reaching 100% on 1st Sept) and Actual progress (solid curve). Check Options a, b, c: On 1st June, the actual progress curve lies below the expected line (a is true); during August, the actual curve has the steepest slope (b is true); the actual curve hits 100% before 1st Sept (c is true). Check Option d: After the two curves cross in August, the actual progress curve lies ABOVE the expected progress line until 1st September. Conclusion: Therefore, statement (d) is NOT correct. Correct Answer: (d) During the period from 1st April to 1st September, at no time was the actual progress more than the expected progress.