Civil Services Examination · Question 64
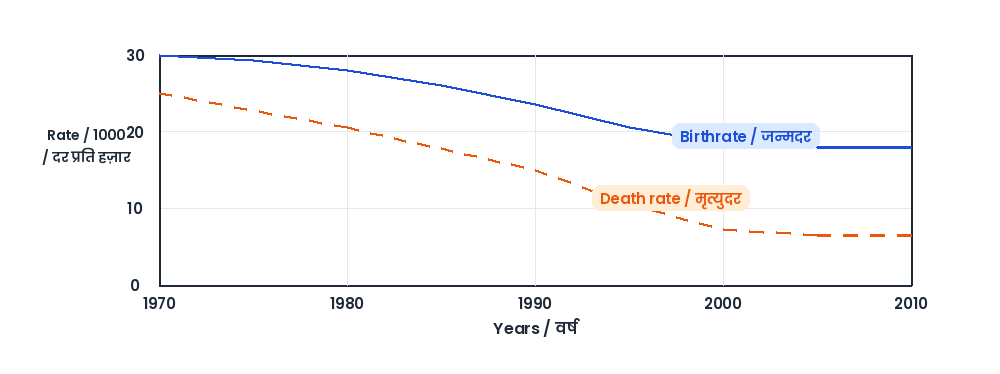
With reference to the above graph, consider the following statements considering 1970 as base year : 1. Population has stabilized after 35 years. 2. Population growth rate has stabilized after 35 years. 3. Death rate has fallen by 10% in the first 10 years. 4. Birthrate has stabilized after 35 years. Which of the above are the most logical and rational statements that can be made from the above graph?
Show answer & explanationShow explanation
Answer: (D) 2 and 4
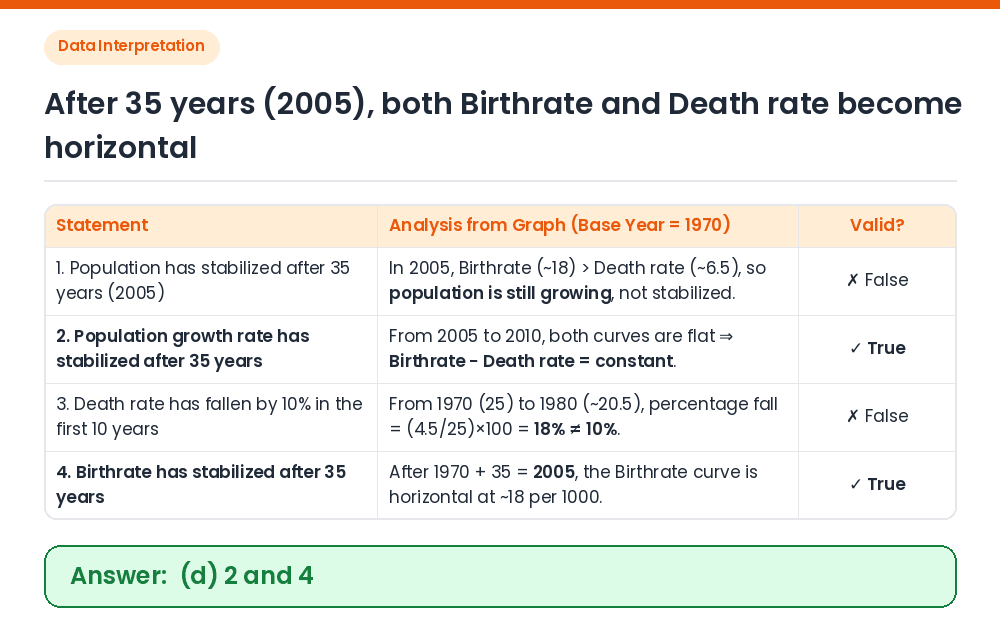
Given: Base year = 1970 ⇒ 'after 35 years' means after 1970 + 35 = 2005. Check Statements 2 and 4: From 2005 (midpoint between 2000 and 2010) onwards, both the Birthrate curve (~18) and Death rate curve (~6.5) become horizontal (constant). Thus, Birthrate has stabilized (4 is true) and the difference (Population growth rate = Birthrate − Death rate) has also stabilized (2 is true). Check Statement 1: Since Birthrate (18) > Death rate (6.5) after 2005, total population continues to increase; only the growth rate has stabilized, not the population itself (1 is false). Check Statement 3: From 1970 to 1980, Death rate fell from 25 to ~20.5, which is a fall of (4.5/25) × 100 = 18%, not 10% (3 is false). Correct Answer: (d) 2 and 4