Civil Services Examination · Question 65
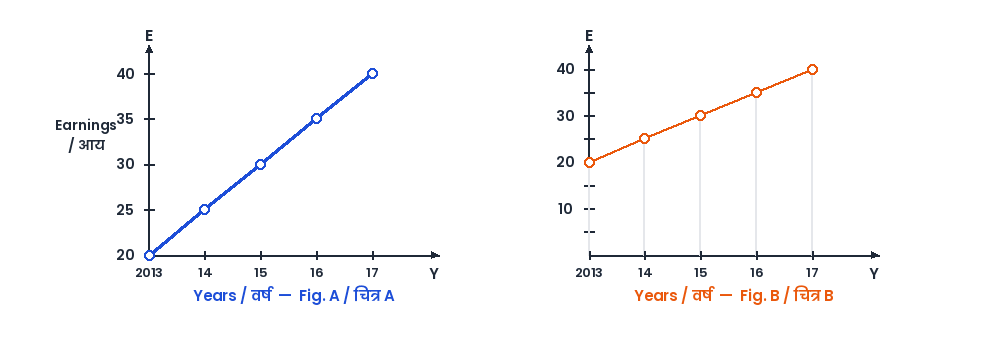
Average hourly earnings per year (E) of the workers in a firm are represented in figures A and B as follows : From the figures, it is observed that the
Show answer & explanationShow explanation
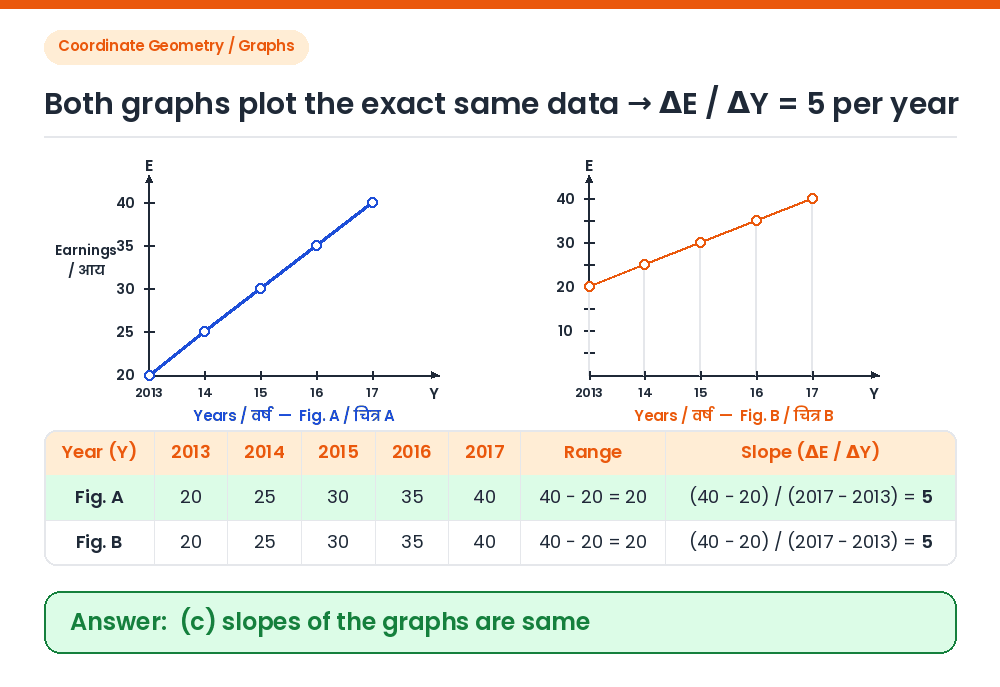
Answer: (C) slopes of the graphs are same
Given: Figures A and B plotting average hourly earnings E against years Y (2013 to 2017) with different vertical axis origins (Fig. A starts at E = 20; Fig. B starts at E = 0). Read values of E in both graphs: In both Fig. A and Fig. B, E = 20 in 2013, 25 in 2014, 30 in 2015, 35 in 2016, and 40 in 2017. Compare range and rate of increase: Values of E are identical, range = 40 − 20 = 20 in both, and rate of increase = 5 per year in both (so a, b, and d are false). Calculate slope: Slope = ΔE / ΔY = (40 − 20) / (2017 − 2013) = 20 / 4 = 5 in both graphs. Thus, the slopes of the graphs are the same. Correct Answer: (c) slopes of the graphs are same